Performance Trends, Inc.
Producing Quality Computer Tools for Racers and Engine Builders since 1986
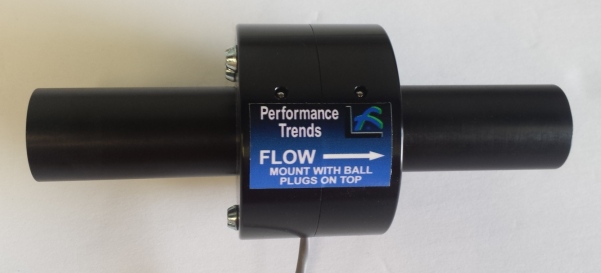
Blowby Sensor to Measure CFM Flow from Engine Crankcase During Dynamometer or On Track Testing
![]() for
information on our Blowby Recorder
for
information on our Blowby Recorder
![]() for
a table on Typical Blowby CFM Flows for Sizing your Blowby Sensor
for
a table on Typical Blowby CFM Flows for Sizing your Blowby Sensor
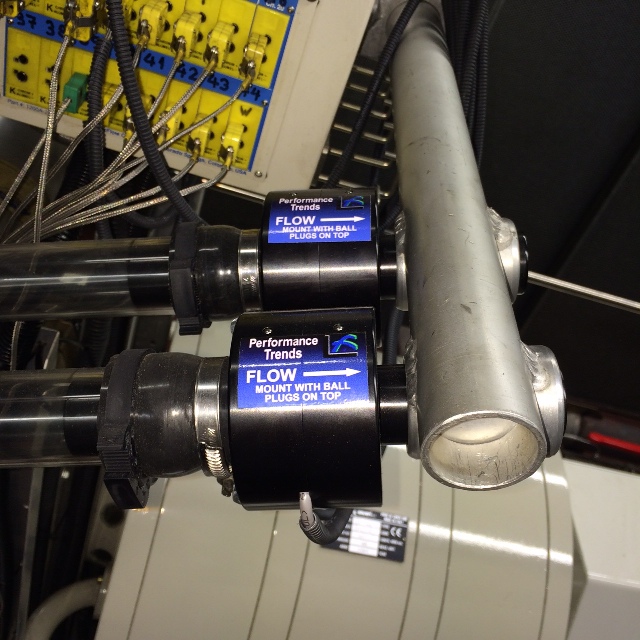
Dual Blowby's Installed at BMW in Europe
 click image to enlarge
The most common checks for Piston Ring sealing are cranking compression and leak down. Both of these can falsely indicate a problem if a small amount of debris is preventing a ring from setting in the ring lands correctly or holding open a valve. The next check you do could show everything is fine. You also do not get a real measure of how well this engine seals up compared to that last engine you built. Neither of these check Piston Ring Sealing while the engine is running. Now with Performance Trends' affordable Blowby Sensor, you can actually measure CFM of blowby during your dyno tests.
Hook up the blowby sensor to your valve cover following the instructions with your sensor. (Click here for a copy of these instructions.) Hook up the electrical lead to one of Performance Trends' DataMite data loggers. Pick the built in Blowby Sensor calibration for your range of sensor and you're ready to test measure the CFM of blowby from your engine at all engine RPMs. Now you can get a history of your engine's blowby levels. For example: last year you were running 3.3 CFM at 4000 and 3.7 CFM at 7000 RPM. This year with your new boring technique, you're down to 2.2 CFM at 4000 and 2.3 CFM at 7000. Now you can really measure if you are going in the right direction.
Other features include:
- Large 1.25" OD diameter inlet and outlet to be able to handle 1000+ HP engines.
- Rugged, all aluminum construction.
- Several flow ranges available (0.3 CFM to 18 CFM standard, and other custom ranges available) to handle most any size engine with good accuracy.
- Can measure small flows in the reverse direction. This is good for diagnostic work and is used by the Performance Trends DataMite software to warn meter may be installed backward.
- Can be used in any dyno system which provides 5VDC power (20 mAmp), can measure a 0-5 volt output and allows you to type in a calibration table of CFM for various voltage outputs. Signal starts at about 1.15 volts and goes up to 4.75 volts in a non-linear curve.
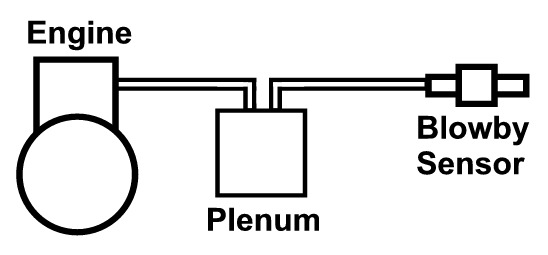
You can even measure blowby on small karting motors, with our new very low 0.3 CFM range sensor. See graph below of data recorded with our Dyno DataMite III logger testing a new clone motor with good ring sealing. Single cylinder motors create tremendous pulsations on the crankcase. To dampen out these pulsations for accurate measurements, you need to place a plenum in the line between the motor and the blowby sensor. See diagram below.
![]() for
more installation tips
for
more installation tips
 click image to enlarge image of typical plenum. Photo courtesy Greg
Finnican
click image to enlarge image of typical plenum. Photo courtesy Greg
Finnican
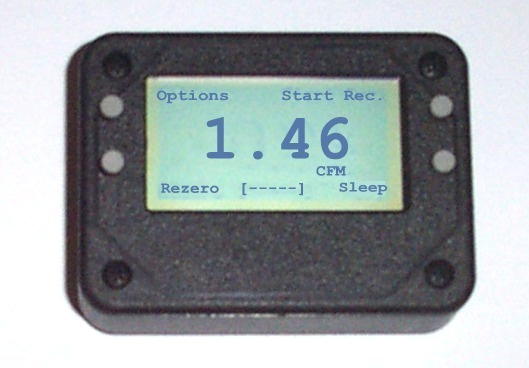
Blowby Recorder
This hand held device lets you display the blowby as either CFM (cubic feet per minute), LPS (liters/second) or LPM (liters/min) without need of a data logger. You can also record blowby for as little as a few seconds or for up to 20 minutes. Then you can playback your data on the Recorder, or download to the free Blowby Analyzer software for graphing, printing, saving, etc.
Blowby Recorder
 Recorder System (click image to enlarge)
Blowby Recorder's main features include:
- User selectable averaging time, from None (meaning 0.1 second readings to catch fast changes) up to 5 second averages for good average readings and long recording times. Recording times of up to 20 minutes, or 1240 data points are available.
- Recorder Options of Start and Stop recording, erasing data, and playback on the recorder.
- Free software lets you send recorded data to your PC for graphing, printing, saving, adding comments, and opening old data files (Win XP, Vista, Win 7, Win 10).
- Display blowby readings as either CFM (cubic feet per minute), LPS (liters per second) or LPM (liters per minute).
- Option to provide a linearized 0-5 volt DC output signal for easier recording by third party data loggers, for example a dyno system or vehicle data logger. (Performance Trends' DataMite loggers can record the standard non-linear output with no problems.)
- Rechargeable lithium Ion battery for long life and charging via USB cable to PC.
- Advanced Calibration factors let you fine tune your blowby meter's calibration.
Blowby Recorder Program
![]() for
an example of an Export File of Blowby Data
for
an example of an Export File of Blowby Data
Newest Features In late 2013 we added a feature to the Recorder to record RPM data with the blowby data. Now you can see the RPM where a particular blowby reading was obtained. See screen below. The black line on the graph is the RPM data, which is also included in the data list to the right of the blowby CFM readings.
2013 Blowby Recorder Program with RPM Data
A user of our Blowby Sensor and Recorder sent us some data they recorded when running a 331 SB Ford on their DTS dyno. The DTS dyno did not have any spare channels, so the separate Recorder was the obvious fix. The data is for 3 back-to-back runs, about 2 minutes of recording time. It shows good repeatability, and how handy it is to have a separate Recorder recording both blowby and RPM. In the highlighted row in the list it shows 2.80 CFM at 6951 RPM at 52.9 seconds into the data set. This data could be exported to Notepad for more analysis if needed.
Recording 116 seconds of data on 3 Consecutive DTS Dyno Runs (one large segment) on 331 cid Ford
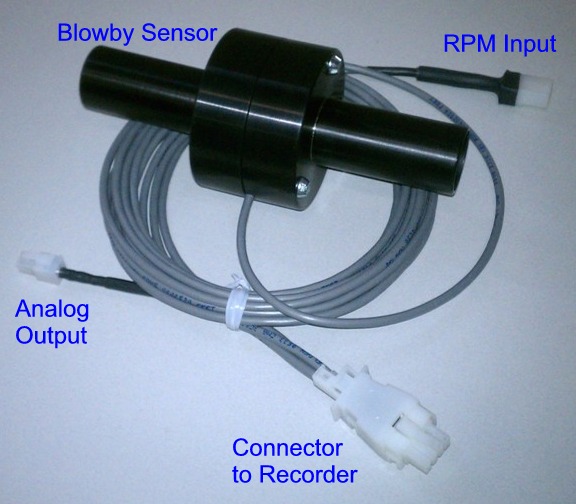
Blowby Recorder Harness for RPM
Input
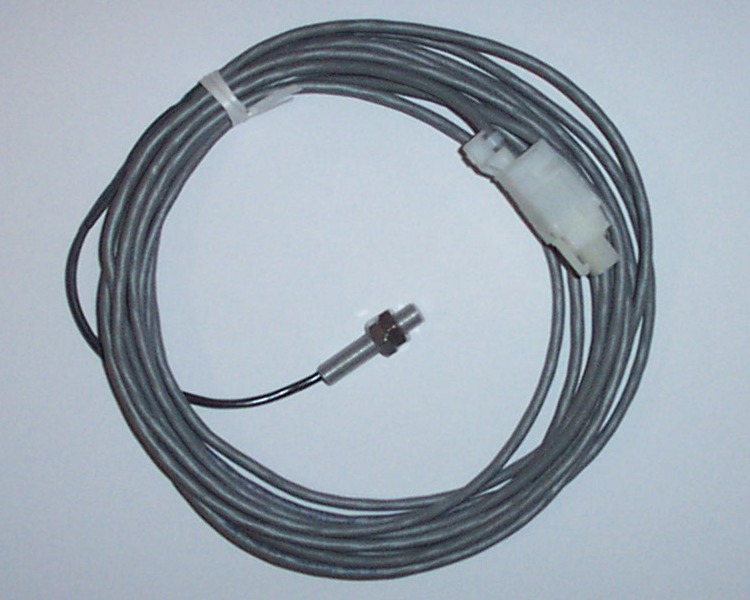
Magnetic RPM Sensor for Blowby Recorder
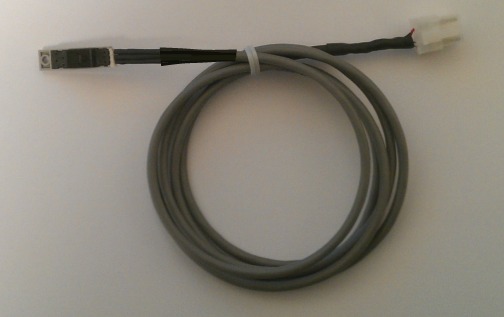
Reflective RPM Sensor for Blowby Recorder DT3-RPMR
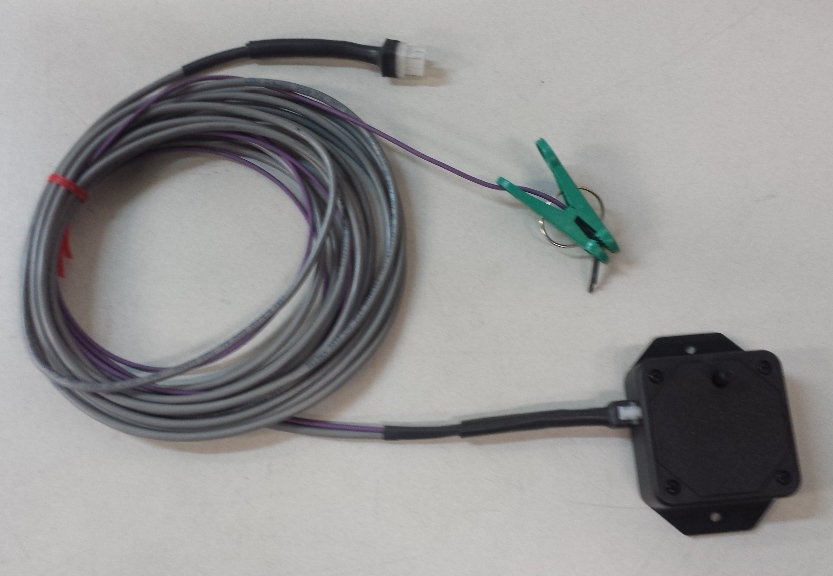
12 volt Tach Signal RPM Input DMC-BLRT
 click image to
enlarge
click image to
enlarge
 click image to enlarge
 click image to enlarge
 click image to enlarge
DTM-IPU inductive Pickup for coil or
plug
Reflective RPM Sensor with
wire, coil on plug, or injector
(shown
more features and longer range
with BB2-IPUH
harness)
DT2-RPMR
 click image to
enlarge
click image to
enlarge

![]() for
an example of an Export File of Blowby Data with RPM
for
an example of an Export File of Blowby Data with RPM
![]() for
the full User's Manual for the sensor and the Blowby Recorder (Note:
If you will install the sensor on your own data logger, the manual will include
calibration curves and equations for the particular sensor range you order,
including the color codes for you to wire the cable to power, ground, and
signal.)
for
the full User's Manual for the sensor and the Blowby Recorder (Note:
If you will install the sensor on your own data logger, the manual will include
calibration curves and equations for the particular sensor range you order,
including the color codes for you to wire the cable to power, ground, and
signal.)
Blowby Calibration Checker In April 2020 we release our Blowby Calibration Checker. You supply regulated shop air and hook up a hose between the checker and your blowby sensor. Read the pressure on the gauge and check the calibration chart to see what the actual blowby reading should be. If your sensor reads close to the chart's reading, you know your sensor is still in calibration.
 click image to enlarge picture of Blowby Calibration Checker, shown with
optional gauge
click image to enlarge picture of Blowby Calibration Checker, shown with
optional gauge
![]() click image to enlarge picture of Blowby Calibration Checker, shown with
optional gauge and attached to Blowby Sensor
click image to enlarge picture of Blowby Calibration Checker, shown with
optional gauge and attached to Blowby Sensor
![]() for
the calibration chart for the 4 different Checker sizes. Note that the
calibration goes up to pressures up to 100 psi, which you can achieve if you
install your own gauge or use the gauge on your air compressor.
for
the calibration chart for the 4 different Checker sizes. Note that the
calibration goes up to pressures up to 100 psi, which you can achieve if you
install your own gauge or use the gauge on your air compressor.
![]() for
prices
for
prices
More Info:
Click here for installation tips.
Customers frequently ask what are the typical Blowby CFM flows they should expect from their engines, and what is too high. The equations in the table below should let you make this VERY APPROXIMATE estimate. The actual blowby level and acceptable blowby limits will vary greatly between different engine manufacturers and engine applications.
| Application | Equation for Typical Blowby | Equation for Blowby Suggesting Rebuild |
| Used Motor, "workhorse vehicle" | .01 x Peak Tq (ft lbs) | .02 x Peak Tq (ft lbs) |
| Modern production motor | .005 x Peak Tq (ft lbs) | .015 x Peak Tq (ft lbs) |
| "Tight" racing motor | .0025 x Peak Tq (ft lbs) | .0075 x Peak Tq (ft lbs) |
For example, if you have a modern production vehicle (naturally aspirated, turbocharged, most anything) which has an advertised peak torque of 300 ft lbs, it will likely produce about 1.5 CFM of blowby (300 x .005 = 1.5). You would consider the blowby high, indicating the rings may be bad if the blowby was over 4.5 CFM (300 x .015 = 4.5 CFM).
Notes:
- High blowby typically does not mean much loss in performance. It has to be VERY high for a performance loss. (However, in racing, even a, say, 0.2% loss in performance could be important.) Our Engine Analyzer Pro lets you simulate different ring sealing to estimate the performance loss due to blowby.
- VERY high output race engines, especially supercharged or turbocharged making 2 or more HP per cubic inch, can produce much higher blowby than what is described in the table above. We've seen 3000 HP race engines produce over 100 CFM blowby. By the table above, assuming the 3000 HP engine produced about 2000 ft lbs, this race engine should have typically only been producing about 5 CFM of blowby (2000 x .0025).
- Blowby typically presents itself as a problem of excessive oil consumption (which can also cause detonation), high oil pan pressure which can blow out seals or prevent oil drain back to the pan from the heads, oil soaked air cleaner, poisoned catalytic converters, etc.
- A customer with Diesel experience said a "rule of thumb" for rebuilding a Diesel engine was when the blowby in CFH (cubic feet per hour) exceeded the HP. So if a 600 HP motor had more than 600 CFH, the motor should be rebuilt. The conversion of CFH to CFM is to divide by 60, so 600 CFH is actually 10 CFM. This rule of thumb in CFM would be for every 60 HP you would expect 1 CFM.
Available Sensor Ranges
| Range * | Useable Measurement Range * | Part Number |
| 0.3 CFM | 0.04 to .4 CFM | DT3-BLB.3 |
| 1 CFM | .12 to 1.25 CFM | DT3-BLB1 |
| 3 CFM | .4 to 4 CFM | DT3-BLB3 |
| 6 CFM | .8 to 8 CFM | DT3-BLB6 |
| 12 CFM | 1.6 to 16 CFM | DT3-BLB12 |
| 18 CFM | 2.4 to 24 CFM | DT3-BLB18 |
| 40 CFM | 5 to 50 CFM | DT3-BLB40 |
* Multiply CFM by 0.47 to get Liters/second, or multiply CFM by 28 to get Liters/minute
One of our customers, John McPartlin, purchased a blowby sensor for his Land and Sea dyno. Here's some examples of his data on his 305 Chevy workhorse motor.
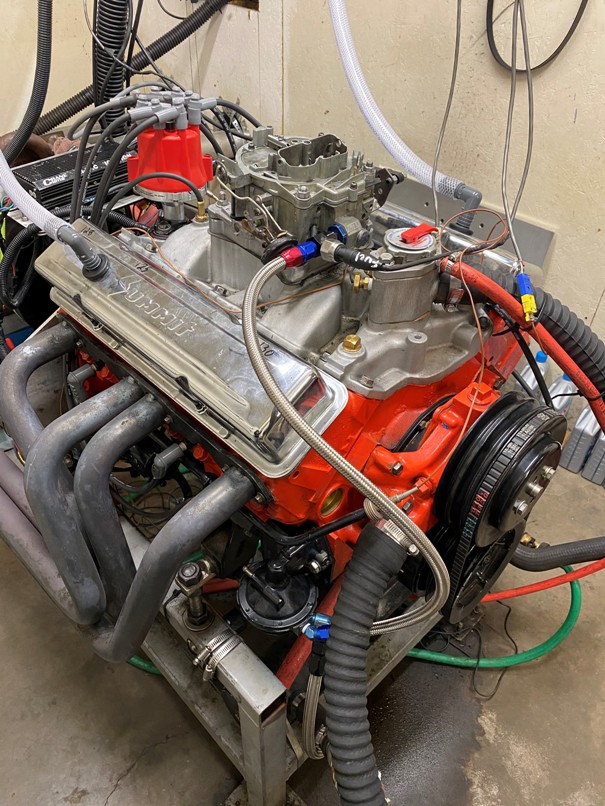
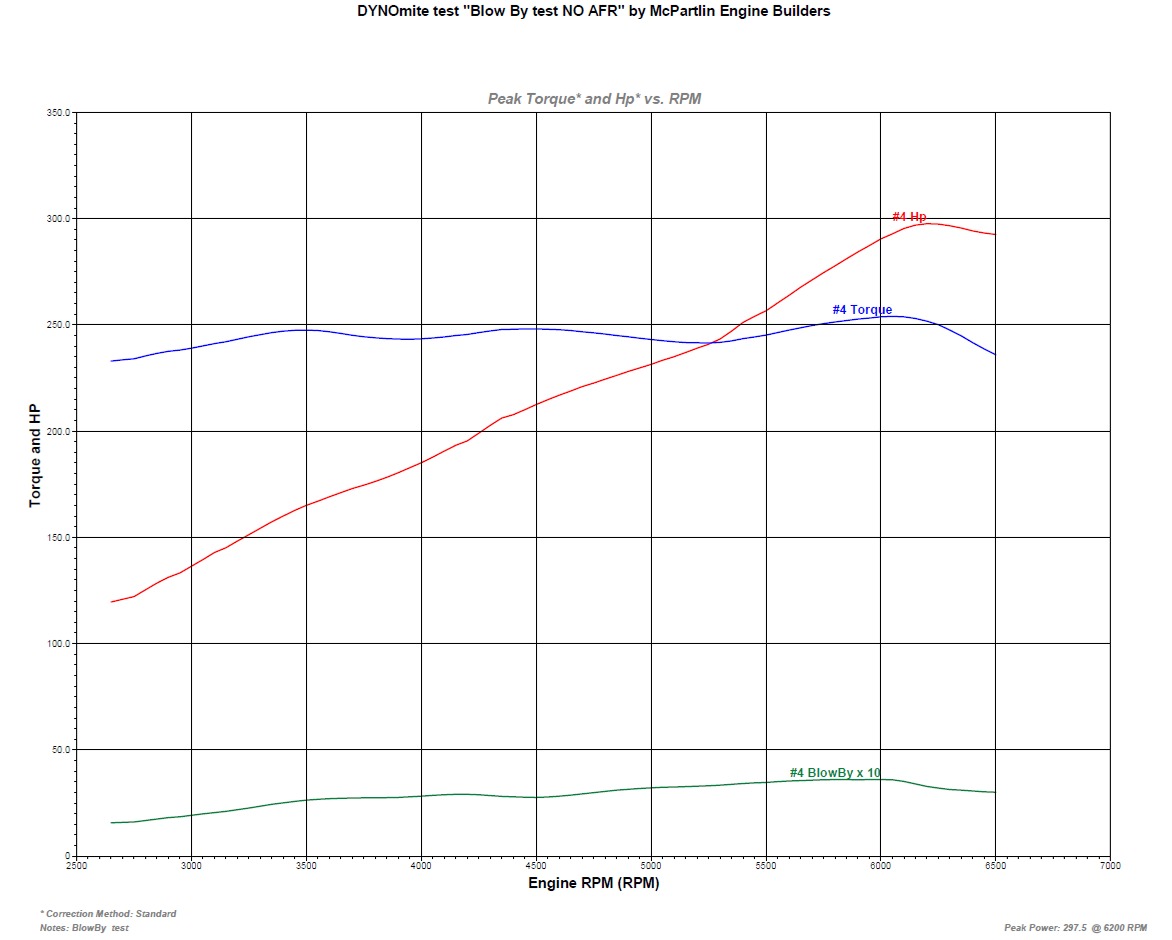
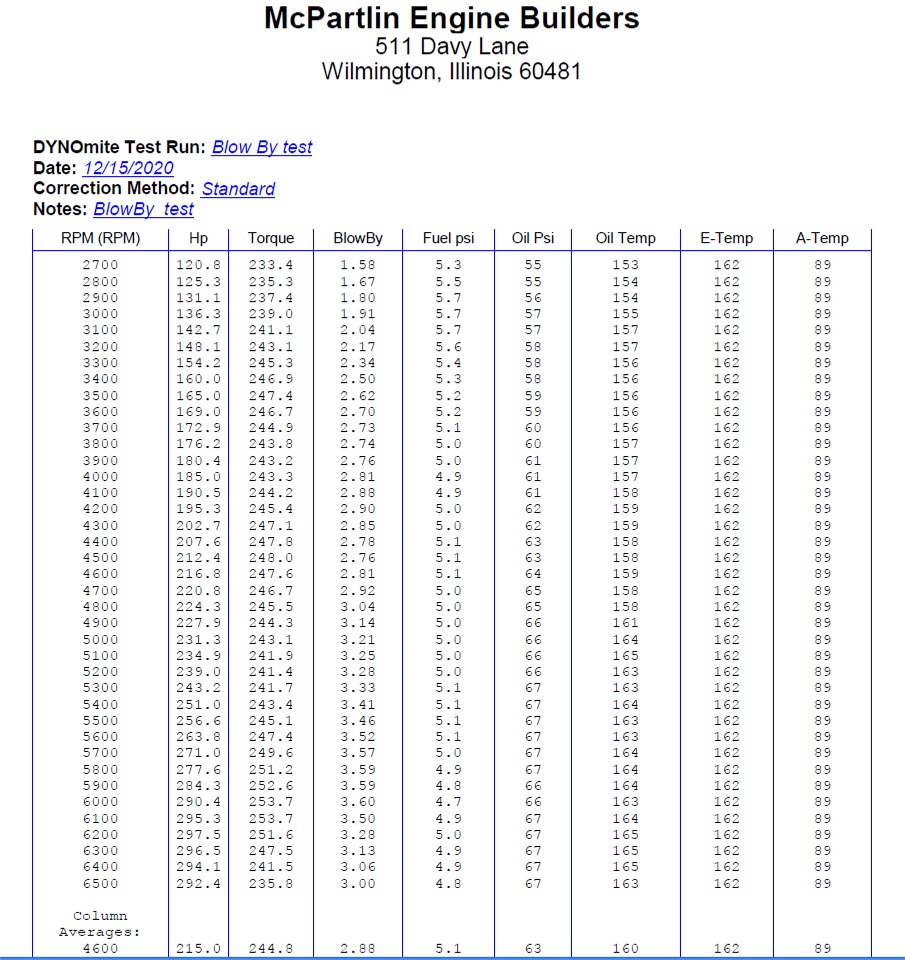 click images to enlarge
 ![]() for
more info
for
more info
To Order:
Click here for prices.
Call 248-473-9230. Visa or Mastercard accepted.
Electronics like Blow By Sensor have a limited 1 year warranty.