Click on one of the following categories:
General Questions
What if I don't know some spec the program is asking me?
Why is the program predicting more performance than I'm
seeing on the dyno (or at the track)?
How do I use a simulation program?
What is the advantage of using a simulation program?
How can I Email you a data file to show you a problem I'm
having with a program?
Can I use your Windows programs on my Apple Mac (Macintosh)
?
What is error 429?
My program runs very slow and is locking up.
The scroll bar in the table at the lower left is flickering.
How do I share data files on a
hub (network)?
My security (virus checking) software says my
program is infected. What should I do?
My software runs, but it takes
1-2 minutes for the graphs to come up. What is wrong?
Performance Trends' software has many
messages. How can I get through these messages faster?
When I press the Function
keys in the Performance Trends software, nothing happens. Why?
Engine Software Questions
Are these (Engine Analyzer) Programs accurate?
The Seat (advertised) Timing for my cam
does not match my cam's actual specs. How can I adjust this?
The program's Seat (advertised) Timing
and Duration for my cam
does not match my cam's actual specs. Can the program still be accurate?
The Roots Supercharger I Installed
Shows No Boost. Why?
I just made a small
change to the turbo specs and it made a HUGE difference in power. Why?
In the Engine Analyzer programs, what is the advantages and
disadvantages of going higher than 75% on the Total Exh/Int %?
How do I simulate a restrictor on an EFI engine with a
plenum and individual runner throttle plates?
Why does the spark advance value only increase by maybe 10
degs from idle to 3000 (even on stock setups) when actual distributors have
15-24 degs of advance?
Which cylinder heads have a "Compact Wedge"
combustion chamber?
How much harder is Engine Analyzer Pro compared to Engine
Analyzer?
Why can't I get the Engine Analyzer to match the factory
torque and HP ratings for 1960s muscle cars?
How do I enter or calculate the "Corrected Compression
Ratio" for my supercharged engine?
Is the Engine Analyzer doing ECA (Engine Cycle Analysis)?
Why does the Engine Analyzer Pro show that some Thermal
Barrier Coatings reduce performance?
Does the Engine Analyzer or Engine Analyzer Pro consider
Port Size (volume) when estimating Performance?
My Turbo catalog only lists lb/min for airflow not cfm as
Engine Analyzer uses. Is there a formula to convert lb/min to cfm??
Can the Engine Analyzer and Engine Analyzer Pro be used for
small engines, like a 5 HP Briggs?
The Spark Curve reported by the Standard Engine Analyzer
starts high, then drops down, then increases again. Is this possible?
Do the Engine Analyzer calculations consider Turbo A/R in their
calculations? Do I alter the Turbo CFM rating to simulate different exhaust
turbine sizes?
I have cam timing specs .020" lift intake and .025"
lift exhaust. Currently I am using the valve lift graphs to determine
where the .050" lift point is from where I see the .020" and
.025" lifts. Is there an easier way to figure this out?
How do I enter the weight of my crankshaft,
pistons or rods so I can see the effect on HP?
What is the formula for determining
Intake Valve Closing angle in the Compression Ratio Calculator?
Why does the Engine Analyzer and the
Engine Analyzer Pro give different results for Detonation (spark knock)?
Why is there a dip in the torque and HP curve at 3500 RPM?
How
do I build an engine to run a certain quarter mile ET and MPH?
How can I speed up the
Calculations in Engine Analyzer Pro?
I've run the same exact
std Engine Analyzer conditions and the Engine Analyzer Pro does not give the exact same
results. Why?
What should I adjust to get the
Engine Analyzer results (std, Plus or Pro) to match my real dyno results?
I'm a little confused about measuring Port Length. Is it measured
along the short side of the port?
How can I export the cam
profiles and cylinder flows and pressures from Engine Analyzer Pro to Excel?
How can I create a cam file to be read by Engine Analyzer Pro or other
Performance Trends software?
I don't know much about my
engine. How can I build an engine file for it?
When
calculating Average Port Diameter, what do I use for the Port Length?
How do I use a
.jpg file of a turbo compressor map for entering a detailed
map into Engine Analyzer Pro Enterprise Edition?
Why does the program show air flow of 600 CFM,
but the carb CFM rating is 850 CFM?
How do I measure the Intake
Runner Length and Diameter for my Individual Runner Weber carbs?
What is the difference between
Designed Valve Lash and Actual Valve Lash?
How do I figure out how to enter
the information the Engine Analyzer Pro needs, for example for Bearing Size
Coefficient?
Port Flow
Analyzer Software Questions
If I build an
EZ Flow flow bench just using a shop vacuum as the flow source, how will that affect my data?
My EZ Flow
System shows I have CFM flow when the motors are turned Off. Why?
My Black Box II will not communicate to my
computer. What should I do?
Does my flow bench
require corrections for weather changes?
How do I copy my
program from an old computer to a new one?
How do I share data files on a
hub (network with shared folder on server and clients)?
I lost the power supply for my Black Box II. Can I get one at Radio
Shack?
What is meant by Master Bench Specs?
(Note: This answer is provided using the example of Master Dyno DataMite
Specs)
My Black Box II
readings do not exactly match my manometer readings at some points. What
can I do?
My Flow Bench readings seem
erratic or inaccurate, even based on my manometer readings. How can I
troubleshoot this?
Besides CFM Flow, what can I measure on a flow bench?
Why won't my automatic valve opener
find the tip of my valve?
What can
I check on my Electronic Velocity Probe to see if it has a fault?
Are the Electronic Velocity Probes as accurate as the traditional pitot
tubes?
I'm having trouble understanding how to get my Valve Opener to work with
my SF1020 to automatically do a flow test. Can you help?
We flow components
like air cleaners at different test pressures. Can the Port Flow Analyzer
do this?
How do
I adjust my Port Flow Analyzer to match the CFM from a calibration orifice
plate?
Does the Port Flow Analyzer and the Black Box
logger work with PTS flow benches?
Cam Analyzer / Cam Test Stand Questions
How does the software know
my cam timing when I measure the cam on the Cam Test Stand?
How do I convert a cam file
(CPP, S96, Cam Dr, etc) to a manufacturing
type file (.p, .igs, .iges, X/Y, etc) for a CNC cam grinder.
I have a cam profile in Excel and I want to use it in my Cam Grinder with
a large grinding wheel. Can Cam Analyzer make that conversion?
How do I create a
manufacturing file to exactly copy of a cam lobe I just measured?
Can I figure out how much to reduce the base circle for regrinding an
existing cam for larger lobes and lobe separation?
Can I create an XY or polar angle/length file for roughing out a cam on my
CNC from .050" duration and max lift data only?
I have an OHC engine, with 2 cams,
an Intake and an Exhaust. How do
I set this up?
I measured my diesel cam with a .750" and .850" roller and show
very little difference. Is this correct?
I measured the cam with the pointer
directly on the lobe and the results don't look anything like the Cam Catalog's
Specs. Why?
My Results do not repeat when I measure the
same lobe again. What could be happening?
I'm using the Virtual Follower feature,
but my results do not look like what the cam should be?
What is the advantage of using
the Universal Flat Tappet (or TDC Checking Bridge) to Find TDC?
Will the software let you
extrapolate from a .750 inch diameter roller lifter to a .800 inch diameter
roller?
Do I need a different follower
for every type of cam I measure?
Do I need to zero out the linear
encoder (lift measuring device) before I measure a lobe?
I've got a cam with multiple lobes for
each cylinder. How can I export a Cam Dr file to the Engine Analyzer Pro?
If I want to check a cam in the engine (or an OHC
cam in the head), what do I do different?
Filtering seems to have a large effect on the
acceleration readings. What is the correct Filtering setting to use?
What is meant by Master Tester Specs?
(Note: This answer is provided using the example of Master Dyno DataMite
Specs)
How can I create a cam file to be read by Engine Analyzer Pro or other
Performance Trends software?
I'm a cam grinder, and I want to see all
lobes spread out like when viewed from the end of the cam. Is that
possible?
My Black Box II will not communicate to my
computer. What should I do?
Can the Quick Cam
Checker create a cam file to be read by Engine Analyzer Pro or other Performance
Trends software?
When I graph the Jerk for a profile,
it just seems to be a bunch of jumpy lines. Why?
Can I find TDC with the
linear encoder on the top of the piston?
How can I tell if a cam is
hydraulic or solid, and if solid, what lash it is designed for?
Why does the Radius of Curvature jump around so much?
I'm
measuring in millimeters. Why do my lobes look so "rough", like
stair steps?
How do I check if the rotary
and linear sensors are good?
Can I import a lobe from 1 file
into another file? or Can I combine 2 files together?
I'm getting a "bump" in my profile when
trying to do virtual follower on a cam file I've imported from a different
software. Can I fix it?
I'm measuring my OHC
rocker arm cam with Intake and Exhaust lobes on the stand (not in the
engine). How do I set this up in the software?
Engine Log Book Questions
What measurement
gauges will load info directly into the Engine Log Book?
My Mitutoyo bore gauge will not communicate
with the Engine Build Log Book. Why?
Valve Spring Tester Questions
After testing my
valve springs, can the software tell me the required install height to produce a
certain seated force?
Drag Racing Software Questions
How can your Drag Racing Analyzer accurately
predict Dial Ins and Throttle Stops if it doesn't let me enter several past ETs
and weather conditions about my car.
I want to optimize my car to
produce the quickest time to accelerate between 2 different MPHs. How can
I do this?
How
do I build an engine to run a certain quarter mile ET and MPH?
Do I always have to make 2 runs to "calibrate" my
Drag Racing Analyzer for predicting Throttle Stops?
How do I import Drag Race
DataMite data into my Drag Race Pro 'Team Engineer' simulation program?
How do I measure the car's
Center of Gravity Height, or CG Height?
Why can't I just type in my
converter's stall RPM and have the program always use it for "stall
RPM"?
How do I adjust my ladder
bars in 4 Link Calculator to prevent wheelstands?
My 4
Link Calculator does not draw my ladder bars correctly. Does that
matter?
Suspension Software Questions
I don't know which suspension
program to get. Can you help? How about Dirt vs Asphalt?
In the Roll Center Calculator and Circle Track
Analyzer, how do I measure where the Frame Mounts for the A Arms are located?
Do you have software which deals with Rear
Panhard Bar settings?
Why doesn't Circle Track Analyzer showing a change in lap
times when I change suspension settings?
When the Roll Center gets close to ground level, it moves
left or right dramatically for small changes in dive and/or roll. Is this
correct?
Can the Circle Track Analyzer be used for dirt track racing?
Can I use my Data
Logger data (from your DataMite II or my own data logger) in your Suspension
Analyzer to see what my suspension is doing on the track?
In Suspension Analyzer, why
is the Ackerman Error not the same for both tires?
In Suspension Analyzer, what
is meant by "binding error"?
The Spring Motion
Ratios calculated in Suspension Analyzer do not match my hand
calculations. Why?
My Suspension is not exactly one of the choices available in the
Suspension Analyzer. How can I simulate it?
How do I measure the car's
Center of Gravity Height, or CG Height?
The programs let me put in Dive and Roll to
watch what happens when the suspension moves. How much should I tell the
program?
Can you explain the
different labels for the 5 Link rear suspension points?
What should I use for the vehicle's centerline when I measure my
suspension?
How can I graph data from my
front suspension with that from a rear suspension?
Dyno DataMite Data Logger Questions
I'm building an inertia dyno
myself. How do I figure out how big to make the flywheel, or the roller
for a chassis dyno?
I'm having trouble getting my USB DataMite to "talk" to my
computer. How can you help me?
When I start my engine (or
go to full power), I lose communications with my data logger. How can I
troubleshoot this?
Do you have classes to teach user's all of the DataMite software's
features?
How do I hang weights on my
dyno for calibrating the load cell for torque?
My torque reading is not reading
zero with the engine not running. How can I rezero the torque (or most any
analog channel) reading?
When
hanging weights to calibrate torque, the numbers can change by how I hang the
weights. How can I be more accurate?
How do I know what A/F
to shoot for when I change fuels?
Can the DataMite software
use vehicle coastdown data on a chassis dyno to estimate driveline losses, and
therefore produce flywheel torque and HP numbers?
When trying to achieve accurate inertia
dyno results, what are the main things to consider?
By accurate, I mean as close to true horsepower as possible.
What are the main considerations when trying
to achieve repeatable inertia dyno results?
By repeatable, I mean test-to-test and day-to-day consistency.
What are the main considerations when trying
to achieve accurate and repeatable water brake dyno results?
When I dyno an engine using an Inertia Dyno
and your DataMite, the HP seems to peak too early, say 9,500 RPM, when I
actually rev the engine to 10,500 RPM on the track. Why?
The Torque Peak and HP peak reported on the
Main Screen is slightly different than what I see on the graph which is slightly
different than what I see on the report. Why?
Can I use just engine RPM or Dyno Wheel RPM
(not both) to calculate torque and HP?
How do I measure Engine RPM on a chassis dyno?
Can I use just your software for
an existing dyno?
How does your software and electronics control the dyno?
How will I run a test with a water brake dyno?
Is my load cell working in
tension or compression?
Can most of the USB DataMite III or 4 features be added later if I
don't buy them now?
How can I troubleshoot bad or "corrupt" data I'm getting from
the Black Box II Dyno System?
Can you do a "coastdown" test on our chassis dyno to measure the
dyno and vehicle losses, and then correct the chassis torque and HP to get
flywheel torque and HP?
How can I email Performance Trends a test from my DataMite software, for
Performance Trends to check out?
My Black Box II (or DataMite II) will not communicate to my
computer. What should I do?
What are the advantages
and disadvantages of an inertia dyno compared to a water brake?
Are there any general tips for
building an inertia dyno?
Could you elaborate on the advantages
(carb tuning related) of the A/F sensor over BSFC?
I have a
twin (2) roller chassis dyno. Do I put the RPM sensor on the front roller
or rear roller?
What is meant by Master DataMite Specs and
Master Dyno Specs?
Should the density altitude go up with the humidity?
I've tried to read up on it but cant make perfect sense of it. Can u please explain?
I'm getting erratic Engine RPM
readings. What can I do?
I am trying to get Engine RPM from
a coil-on-plug COP engine. What can I do?
My DataMite will hang up (stop updating the screen) during a dyno
test. What can I check?
How can I use the
weather readings in my Dyno DataMite software to tune carb jetting at the track?
I have a dyno run with
noise spikes in the RPM signal which the program can not edit out. What
can I do?
I need my brake dyno to measure
torque in both directions of rotation. Can you set up a load cell to do
that?
My dyno wheel (or
chassis roller) RPM measurements seem very jumpy. Why?
My Inductive
Pickup does not seem to read RPM. Why?
I'm using
the Engine Inertia correction for my water brake dyno. How can I see how
much effect it is having on the results?
The torque and HP
will peak at different RPMs depending on if I measure or calculate the engine
RPM on my chassis dyno. Why?
When running my dyno, the computer will sometimes lock up and I have to restart it. How
can I troubleshoot?
Why should I measure weather
conditions when engine testing? Does this produce what they call Corrected
Torque and Corrected HP?
My RPM Reading sometimes
reads double of what it should, and sometimes reads correct. Why?
How should I size a fan for my dyno room?
I have a fuel flow sensor from
a different data logger company, but am reading it with your DataMite. Why
doesn't it read until the flow is quite high?
How does a brake dyno
(water brake or eddy current brake) dyno work?
My torque and HP are low and both
peak at the same RPM. Why?
The air for my motor is different
than the air for the DataMite logger. Will the Weather Corrections still
be accurate?
Is there an
easy way to adjust the inertia of my inertia dyno to get the torque or HP number
I want?
You say your water brake controller
does not control the RPM sweep rate, but the valve opening rate. Why?
How
can I mount Performance Trends sensors on my Land and Sea (tm) Dyno?
Can I keep using
my SuperFlow (tm) controller if I use your DataMite for data logging and
analysis?
My peak HP (but could be
torque) seems to change a lot and is not repeatable. Why?
How can I check out my DataMite
System without a dyno or engine?
How do I get my DataMite program going on a new computer (transferred
over)?
How long are the cables for the typical Dyno DataMite system?
Are there instructions that come with the Dyno DataMite system?
My updated Dyno DataMite v4.2 A.062 gives an error message about
"data missing". What does this mean?
How can I make my flow meter
read Gallons per Minute for water?
My updated Dyno DataMite software is saying "x.xx seconds of data
missing" from my dyno test. What does this mean?
My A/F readings seem too lean,
especially at idle. What could be wrong?
How do I
measure ignition timing (spark advance) with my DataMite 4?
Drag Racing and Circle Track/Road Racing DataMite Data Logger Questions
My MSD Grid
(tm) ignition (or most any other high energy ignition) is producing electrical
noise and interfering with the RPM signals. What can I do?
My car seems down on power. How can I check it?
Can I measure spring
and/or shock loads on my car on the track?
I
click on the Run Number down the left side of the screen and it does not open
the correct run. What am I doing wrong?
Road Racing Software Questions
I want to optimize my car to
produce the quickest time to accelerate between 2 different MPHs. How can
I do this?
Can I
use my Data Logger data (from your DataMite or my own data logger) in your
Suspension Analyzer to see what my suspension is doing on the track?
Can the Circle Track/Road
Race DataMite analyze my shock's performance with graphs and histograms?
My RPM
measurements seem very jumpy. Why?
Shock Dyno Questions
Can you explain what the different Shock Dyno
Graphs mean?
My shocks are rated at
a 6 compression and 3 rebound. What does that mean?
Do you have any technical info
on reading the Shock Dyno results and adjusting the Shocks?
Can I measure spring
and/or shock loads on my car on the track?
I only have the
basic version of the software. What's the most accurate way to eliminate
the gas force from the data?
My "Football"
graph (sometimes called a "potato" graph) has "bumps" in
it. What does this mean?
My dyno motor won't
start. How can I troubleshoot the wiring?
Questions on Other
Tools
How much blowby should my engine produce and
how much is "too much"?
My blowby measurement
changes from test to test. Why?
Can the Quick Cam
Checker create a cam file to be read by Engine Analyzer Pro or other Performance
Trends software?
Can the Quick Cam
Checker check a cam on the stand by barring over by
hand?
What is meant by
"aspect ratio" in the Spring Wiz program?
General Questions
What if I don't know some spec the program is asking me?
Most all programs have a library of example specs loaded for you to start
with. For example, in the Engine Analyzer there are over 70 complete
engines pre-loaded by Performance Trends. Try to pick an engine close to
what you will be building. Then if you don't know some spec, just leave
the value which is already loaded for the example engine you started with.
Many programs have some way to "Get Examples" of components. For
example, in the Engine Analyzer, there are over 300 example Heads
pre-loaded. Some are specific like "Stock Chev Big Block Iron Rect
Port", and some are general like "Typical Ported 4 Valve for 3.8"
Bore".
Some specs are shown with a "Clc" button to their right which stands for "Calculate". An example is Compression Ratio.
You can enter a compression ratio directly by just typing it in if you know
it. Or you can calculate it from other specs like Chamber Volume, Gasket
Thickness, etc.
In most all programs, when you click on a spec a brief description of the spec
is displayed in the "Help" box on that screen. Many times this
"Help" includes a page number in the manual if you want more
explanation (for programs that come with manuals).
If you are building something completely different than any specs pre-loaded
in the program, make a good estimate of the spec and calculate
performance. Then make a change to the spec and recalculate performance
and see the effect on performance. Lets say you don't know the Frontal
Area for your 13 second, 66 Nova when running the Drag Racing Analyzer.
You see from the example vehicles that a 69 Mustang is rated at 22 square feet
and a 70 Corvette is rated at 19. You calculate performance for your 66
Nova using 22, and then 19 and see only a .018 second change in ET. This
tells you that for your particular car, Frontal Area is not that important, and
some number like 20 or 21 will work fine.
However, if you car was running in the 10s at 130 MPH or so, Frontal Area
would be much more important. Then you may want to come up with a better
way to estimate Frontal Area. Also see the "How do I
use a simulation program?" question below.
Back to Top
Why is the program predicting more performance than I'm
seeing on the dyno (or at the track)?
Simulation programs are predicting how things should work with all systems
working properly, carbs metering properly, ignition systems firing perfectly
every time, combustion chambers burning efficiently every firing, etc.
They can predict a mis-match of parts, but can not predict a improper operation
or failure of some component. Therefore, programs are usually predicting
"best case" performance.
Back to Top
How do I use a simulation program?
We are always getting phone calls saying that these programs must be
"magic" because the results exactly match the "real world"
of peak HP on the dyno, or ET at the drag strip. The important thing is not
that the program matches some dyno's measurements (because another dyno
can easily produce 5-10% different results), but do the programs match the
dyno's trends accurately.
For example, if you change header primary length 4 inches, does the program's
predicted trends match the dyno's trends. Even if 2 different dynos give
10% different HP numbers, both should show the same trends and both can be used
to improve engine performance. If the program can predict the trends
accurately, then the program can also be used to improve engine
performance. Fortunately, we get just as many phone calls saying the
programs are predicting the trends accurately also.
That's why we have more inputs in our programs than most others. Its
not to be more accurate at predicting performance, but to let you try more
modifications to see performance trends. What do I gain by
blocking the crossover? What happens if I can quicken my shifts?
What happens if headwind changes? Although the programs are very good at
predicting the final performance (like HP and ET), the true power lies in
letting you try nearly an unlimited amount of combinations to find the best one.
Back to Top
What is the advantage of using a simulation program?
Computers will never replace track or dyno testing. However, computer
simulations do have several advantages:
-
The difference between running 1st and last in
many competitive forms of racing may only be a 1-2% difference in HP, or
cornering ability, or reaction time. The way to become more
competitive is to make many small improvements (maybe only 1 or 2 HP at a
time) which add up to a larger improvement. In track or dyno testing,
test to test variability can "cloud" the actual results.
Computers repeat exactly each time so trends can be more easily found.
-
The computer is fast and cheap. Many
modifications can be done in minutes for free which would require weeks of
testing and thousands of dollars in parts (throw in a few bruised knuckles).
-
The computer is not limited by current
technology. You can try modifications
which your competition has never even dreamed of.
Try a "fast burn"
head which only needs 10� of spark at 8000 RPM.
Try headers or intake
manifolds with 100% anti-reversion.
Install a 4 valve head on a 5
HP Briggs & Stratton.
Try an extremely aggressive
cam with only 180� Duration and .800" valve lift.
Rev a low friction Chevy
(1" diameter
rod & crank journals) to 12000 RPM.
When you find a new design with big gains, you will
find or develop the required technology. Then use your dyno to verify and
fine tune the "computer optimized" designs.
-
Simulations let you get inside the engine or
vehicle to actually see and understand how things work. Watch Camber
change as the car rolls. Watch the exhaust blow down the exhaust pipe
when the exhaust valve opens.
Back to Top
How can I Email you a data file to show you a problem I'm
having with a program?
This example is for our Engine Analyzer v3.0, but is very similar for other
programs: The way to e-mail a file is to first save the engine file. Then go
into the ENGDAT folder and attached that file to an e-mail. Send the e-mail to: feedback@performancetrends.com
Be sure to include some explanation of why you are sending the file even if you
talked to use or Emailed before. We talk to and receive many Emails from
many people every day.
Back to Top
Can I use your Windows programs on my Apple Mac
(Macintosh) ?
Most modern Macs can run Windows programs without any problems. Apple
has its own software called Boot
Camp to run Windows programs. Third party programs like Parallels,
VMware
Fusion, and VirtualBox
are also available. Please check the specs of these programs, as they can
change. Most all Performance Trends programs are 32 bit Windows
applications.
We recently had a customer report he could NOT run our Circle Track Analyzer
v4.0 on Mac with 12 Core CPU, 30 Core GPU running Parallels Desktop 18, so there
can always be special cases.
Another user reported that our software ran perfectly on his MacBook with a
Windows Boot Camp partition.
 for one customer's experience running our Shock Dyno program with his Mac Book
Back to Top
What is error 429?
This error message can appear if a software company does not install the system files
correctly. If the error message includes the name of a file (commonly
Resize32.ocx), it probably means that there are multiple copies of this file on
your computer. The correct location for system files is typically in the Windows\System
or Windows\System32 folder. (Performance Trends always installs
system files to these locations to prevent this problem.) Copies of the
file in other locations are probably the problem.
For fix the problem:
- Click on Start (lower left corner of your desktop), then Search, then
Files and Folders.
- Then type in the name of the file causing the problem. In the
example above, you would type in "Resize32.ocx" (without the
quotes).
- For "Look In", be sure to select All Hard Drives.
- Then click on Search.
- You should at least find 1 occurrence of the file. If not, you did
not type in the name correctly or did not look in All Hard Drives. Try
again.
- If you find more than 1 copy of this file, rename those NOT found in
either the Windows\System or Windows\System32 folder as something
else. For example, rename Resize32.ocx as Resize32.ocx.bak (add .bak
to the end of its name). (Note: The folder where you find this
file should give you a clue as to what software company did not install the
system file correctly.)
- Now restart your computer and see if this error message is gone when you
run the Performance Trends program. If not, reinstall the Performance
Trends program and then see if the error message is gone.
Back to Top
My program runs very slow and is locking
up. The scroll bar in the table at the lower left is flickering.
We've seen this problem on our DataMite, Cam Analyzer and Port Flow Analyzer
programs. It could be a problem on other programs also but just shows up
differently. This is a rare problem and is NOT repeatable for any
particular computer, program or operating system, meaning we can not predict if
it will happen. The solution has been to reduce the screen resolution,
from say 1440 x 900 to something like 1024 x 768. This is done by clicking
on Start (lower left corner), then Control Panel (possibly Settings, then
Control Panel), then Display (possibly Personal Settings in Vista, then
Display), then Settings tab. Slide the slide bar for Resolution to a lower
setting and then keeping these changes.
Note: Since we wrote this FAQ, we have discovered what is causing this
problem, and have put fixes in most of our programs. If you experience
this problem, check to see if you have the latest version of the software at our
downloads page. If you don't have the latest,
update your software (there may be a charge depending on your version). If
you do have the latest, please let us know you are having the problem and we'll
get the fix implemented.
Back to Top
My security (virus checking) software says my program
is infected. What should I do?
First, it is very possible it is a "false positive", which means there really is NOT a virus
there. This is a common problem with the free virus checkers. Can you check with a different virus protection
software to see if it also says there is a virus there? If a 2nd program
does NOT find it, assume there is no virus.
If you think a program really is infected...
Install the same version from our website. This is not critical, but when asked, select to do a Refresh installation instead of a Complete (typical) installation.
See if the virus warning goes away.
If it does not:
- Is the warning saying the main ".exe" file is infected.
The reinstall described above should have fixed that. Therefore, it is
pointing even more strongly that it is a false positive. There really
is NOT a virus present.
- If the warning is coming from a small, support file (like a .doc or .txt
file), let your virus protection software deal with it (quarantine,
etc). If the virus protection software can not fix it, try
renaming the file by putting a .bkp at the end of the files name
(helpp12.txt changes to helpp12.txt.bkp). Then run the program and see
if it runs OK. If it does, delete the file. You may get an error
at some time when this file is needed in the future, but perhaps never will
depending on what you ask the program to do.
My software runs, but it
takes 1-2 minutes for the graphs to come up. What is wrong?
We have seen this when a customer is using Bitdefender (tm) security.
Everything works fine except the graphs take VERY long to come up, possibly up
to 2 minutes. If you go into the Bitdefenders settings screen, then click
on the Protection item on the left, it gives you an option of Advanced Threat
Defense (not shown in screen below). Click on the Advanced Threat Defense
option to see screen below, click on Settings and slide the Advanced Threat
Defense button to the left to turn it off. Close this screen and problem
should be fixed.

Back to Top
Performance Trends' software has
many messages. How can I get through these messages faster?
When I press the Function
keys in the Performance Trends software, nothing happens. Why?
These 2 questions are related, and we've produced a document to explain them.
for an explanation of these questions
Back to Top
Engine Software Questions
Are these (Engine Analyzer) Program's accurate?
(Background: This was asked on our website and we had several of our users
provide "glowing endorsements". Thanks everyone for the endorsements!)
Our registration cards run about 98% having positive to very positive
feedback. The 1-2% with negative feedback usually are because they bought a
program that was more than they wanted. Like Dave Koehler said, it may be best
to start with the standard Engine Analyzer unless you are VERY familiar
with computers and engines.
Any of our computer programs are tools, like a torque wrench or camber gauge.
They don't automatically make your car faster, but let you work smarter if you
use the tool correctly. You working smarter is what ultimately makes your car
faster.
No computer simulation replaces dyno or track testing. GM, Ford and Chrysler
have invested millions of dollars on simulation programs which can still be off
several %. That is why they still use dynos and test tracks. However, they are
still using (and increasingly so) simulation programs because it gets them
closer before they start building their first prototypes. It also helps them
understand what might happen with trade offs with the actual parts and what
potential problems they might encounter. For example, if the actual engine idles
at 18" vacuum, but the program predicted 20", the program can show
that reducing overlap 4 degrees gets them 2" more Idle Vacuum to get the
actual engine to idle with 20" vacuum.
(Update Feb, 2010) We should expand on this answer, as this is a very
common question. Probably once a month we have customer's call up and say
our Engine Analyzer program's are within 1-2% of the engine dyno. We love
to hear about this excellent correlation to a dyno, but realize that if they
took their engine to a different dyno, the second dyno's results could easily be
5% different from the first dyno. We also know that you could have your
first 4 engines you simulate match the dyno within a couple of percent through
the entire RPM range, and then the 5th engine could be 10% off.
What these Engine Simulation programs are doing is showing the potential
of a certain combination of engine specifications. They will help you
chose a cam, header, carb CFM rating, etc for a particular engine size and RPM
range, idle vacuum requirements, etc. They can not anticipate
problems, like a combustion chamber which does not want to burn
efficiently, an A/F mal-distribution problem, an oil windage problem in the oil
pan causing very high losses, etc.
For more explanation on Accuracy for these programs, open up our user manuals
and check the Appendix in each titled "Accuracy and
Assumptions". Click on the links below:
Std Engine Analyzer User's
Manual Engine
Analyzer Pro User's Manual
Back to Top
The Seat (advertised) Timing for my
cam does not match my cam's actual specs. How can I adjust this?
The Ramp Rating feature in Engine Analyzer Pro and Engine Analyzer Plus lets
you fine tune cam profiles. You can enter either .050" and seat
timing duration, OR .050" and .200" duration and calculate a Ramp
Rating to produce a cam profile which matches those 2 duration inputs. We
don't have a feature to match all 3 at this time (April 2012). However, in
Engine Analyzer Pro we do have an additional input to better define the cam
profile, the Designed Valve Lash. We let you say a cam is designed for,
say, .010" lash but specify that you will set the lash at .020".
This allows the program to "cut off" some of the more gentle part (low
lift part) of the opening and closing ramps.
The graph below shows how we kept the Actual Valve Lash at .020" for 3
different Designed Valve Lash settings. You can see that the Duration at
Seat Timing (advertised duration) changed significantly, from the high of 320
degrees at .020" Designed Valve Lash down to 296 degrees at .005"
Designed Valve Lash.
Back to Top
The program's Seat
(advertised) Timing and Duration for my cam does not match my cam's actual
specs. Can the program still be accurate?
This is a common question, that Seat Timing events, especially the Intake
Closing event, is critical for predicting engine performance. One reason
for this is this number is used in the formula for Dynamic Compression Ratio
(compression calculated based on cylinder volume at intake closing instead of
total cylinder volume).
This would be somewhat true if the valve immediately snapped to full open at
the opening event and then snapped back close at the closing event.
However, that is not what happens. The valve is gradually opened and
closed to keep the valve train from self destructing. In addition, because
of a real valve train bending and flexing, the valve does not even lift when the
cam "tells" it to. You may have a cam which is suppose to close
at 84 deg after BDC, but once the engine starts running, the valve may actually
close at 80 deg, 76 deg, or even earlier. This is affected by RPM,
mass of valve train components, valve spring loads, valve train rigidity,
etc.
Look at the figure below. It shows how the actual valve lift profile is
significantly smaller than what you would think because of these factors.
The table shows that the intake closing event has dropped from 84 degrees (as
the cam is designed) down by 16 deg to 68 deg at 7000 RPM. It is not as
though these ramps are not important. They have a huge effect on how
quickly the valve opens once it does open, and on the stress put upon the valve
when it closes.
 (click picture to enlarge)
The picture below shows the detail of the closing ramp.
 (click picture to enlarge)
This table shows how the Intake Closing Event changes with RPM.
| Engine RPM |
Intake Closing Event |
| As cam is designed, with a perfectly stiff, zero- mass valve
train |
84 deg ABDC |
| 1000 |
80 deg ABDC |
| 3000 |
76 deg ABDC |
| 5000 |
72 deg ABDC |
| 7000 |
68 deg ABDC |
So, how do I use this information? Use the .050" (or 1 mm
(.040") lift for metric or .053 for Harley Davidson) specs for entering cam
data. For calculating a Ramp Rating (for Plus and Pro version), use the
.200" lift duration if you have it. Then if you want to further
refine the profile in the Engine Analyzer Pro, view the FAQ
above (click on blue link).
Back to Top
The Roots Supercharger I Installed
Shows No Boost. Why?
Roots superchargers make boost because they pump more air CFM than the engine normally would pump without a supercharger. If you install too small a supercharger or have too low a belt ratio, a roots supercharger will actually be a restriction and produce manifold VACUUM instead of boost
You've chosen a supercharger which is TOO SMALL for this big an engine. Either put on a bigger supercharger or increase the belt ratio, either one will pump more air to the engine.
Click on the blue link to our Supercharger
Boost on line Calculator to better understand how this works.
Back to Top
I just made a
small change to the turbo specs and it made a HUGE difference in power.
Why?
A turbocharger makes power from the
engine's exhaust being force through the exhaust turbine. This turbine is
connected to a compressor on the inlet side to create boost pressure. If
this turbine is too big, then no pressure will be produced and no boost will be
produced on the inlet side. If you start to reduce the size of the exhaust
turbine, then pressure will be created, which will produce power to compress the
inlet air producing more boost. This more boost will produce more exhaust
flow which produces more boost. This affect will "snowball"
(feedback on itself) until very large levels of boost will be produced rather
quickly.
This is why a small change in some engine specification, RPM, Turbocharger
Specs, and especially Exhaust Turbine Nozzle Diameter can have a HUGE
effect on the performance. The graph below shows a Porsche 2.5L with a
Turbine Nozzle Diameter at 1.7" diameter (too big) and the factory size of
1.3" (sized correctly). Just this relatively small change bumped up
the boost from about 2 psi boost up to about 20 psi, and the power almost
doubled from less than 200 to close to 400 HP.
In the Engine Analyzer programs, what is the advantages
and disadvantages of going higher than 75% on the Total Exh/Int %?
The 75% number has been developed from experience over the last 60 years or
so. Taylor from MIT developing aircraft engines in WWII was one the first to
come up with this # that I know of.
If you have more than 75%, it does NOT means you should restrict the exhaust.
It does mean that there is probably more benefit to enlarging the intake valve
at the expense of the exhaust valve. Since a bore only allows an intake and
exhaust valve combo so big, there usually must be a tradeoff. If you make the
intake bigger, the exhaust must get smaller.
This 75% (85% for Nitrous Oxide or supercharged) is VERY general, and
reported for info only. It is not used in the program to predict performance, as
those calculations are much more detailed.
How do I simulate a restrictor on an EFI engine with a
plenum and individual runner throttle plates?
The best way is to pretend the vehicle is using a single plenum EFI Type
manifold with appropriate length runners, a plenum matching your air box, and
then a restrictor ahead of that To calculate the Carb/Throttle Body CFM rating,
click on the Clc button for Carb/Throttle Body CFM Rating. Then just use the
dimensions of the restrictor. (The restriction of the other throttle plates in
the runners is negligible compared to the restrictor.) For a "perfectly
designed" venturi type of restrictor, the "% Improved" spec in
the Clc menu should be about 150%.
Why does the spark advance value only increase by maybe
10 degs from idle to 3000 (even on stock setups) when actual distributors have
15-24 degs of advance?
Required spark advance is a complicated subject, especially when you the
program tries to predict when detonation will occur. A/F distribution, thermal gradients
(differences) across the heads, pistons, etc, combustion chamber design, are
just a couple of things the program must make assumptions about. Then we have
the factory, which has many different things to consider than just detonation
and best power, things like: lighting off the catalysts fast, max catalyst
temperatures, transient response, knock sensor calibration, cold start
strategies, warranty, transmission durability, etc, etc. That the program does
not match the factory calibration is not surprising.
Just a note, idle at 700 RPM is a very different condition than full throttle
at 700 RPM, both requiring very different spark advance. Idle or some part
throttle conditions may want up to 50 degrees of spark advance. Because of the
light load and possibly EGR it may not detonate. But the same RPM at full
throttle may only be able to run 10 degrees before it starts to detonate.
Which cylinder heads have a "Compact Wedge"
combustion chamber?
Compact Wedge is a chamber which has had considerable race development to
improve Burn Rate and efficiency (power for a given amount of fuel & air
intake). This includes "cutting edge" Winston Cup, Formula 1, and NHRA
Pro Stock type of engines. The "chamber" is actually a combination of
the chamber in the head and the Piston Dome design, and how closely they come
together in the quench zone.
Most any combination that simply takes "this head" and puts it with
"that piston", without careful dyno study, would NOT be considered a
"compact wedge".
How much harder is Engine Analyzer Pro compared to Engine
Analyzer?
When people ask your question, we usually recommend the std Engine Analyzer
which sells at a much lower cost. Should you get comfortable with it and want to go to the Pro
version later, you qualify for a significant discount. Therefore, you are only out
small amount
for getting the standard Engine Analyzer first.
The Pro's more inputs and many more features (menus, commands, etc) can be
overwhelming at first. More inputs can also mean more chances to input a wrong
measurement, which will produce more inaccurate results than accurate results.
Why can't I get the Engine Analyzer to match the
factory torque and HP ratings for 1960s muscle cars?
Unless you have the actual curves and know how the engine was set up, it is
difficult to know exactly what the factory was doing. In the "old
days", the factory would put on headers, block the crossover, change the
spark and fuel curves, run open exhaust, etc, etc to get "factory
ratings". This changed around 1972 when power ratings suddenly dropped.
You've seen the "heads up" comparisons between old and new production
cars in recent magazines. How else is it possible for modern 300HP Corvette to
"blow the doors off" a 1968 425HP Corvette.
Also, if the factory marketing department wanted to "push" low RPM
torque, they would simply pick a low RPM point off the torque curve, even if it
was not the peak. In addition, dual plane intake manifold tuning is difficult to
simulate accurately. Some of these engines could have made more low end torque
than the Engine Analyzer program estimates.
Back to Top
How do I enter or calculate the "Corrected
Compression Ratio" for my supercharged engine?
The Compression Ratio stays the same, whether supercharged or not.
Compression Ratio is a volume ratio and does not change with pressure. To try to
explain that supercharging increases cylinder pressures and the tendency to
knock (detonate or ping), people have come up with this idea of an
"effective" or "corrected" compression ratio based on boost
pressure and static compression ratio. However, if everything that effected
cylinder pressures and the tendency to knock would have an "effective
compression ratio", then we would have one for cam timing, carb size, port
restrictions, type of fuel, nitrous oxide, RPM, etc., etc. This term is rather
"old fashioned".
The Engine Analyzer program is considering all these aspects of supercharging
"behind the scenes". You will notice that torque (an indication of
peak cylinder pressures) goes up and the tendency to spark knock goes up when
you start increasing boost. (The Pro version would actually graph you cylinder
pressures with and without boost for comparison.)
At present, we don't feel a need to display a "Corrected Compression
Ratio" in the Engine Analyzer Results. That is not to say we won't do it in
a future version if we get other requests.
Back to Top
Is the Engine Analyzer doing ECA (Engine Cycle Analysis)?
In general, ECA means to analyze the Cylinder Pressure over the 720 deg, 4
stroke cycle. Usually this is by measuring cylinder pressure and crank degree
very precisely and quickly. Much can be learned about performance by doing this.
EA30 does NOT display this type of simulated data, however the EA Pro does. EA
Pro also displays many other "cycle" details like port pressures and
velocities, piston acceleration or thrust on the cyl. wall, pushrod force, valve
opening, etc. If this is the type of detail you want, I'd recommend the EA Pro.
Download the demo to see yourself. If you already own EA30, you get a discount
upgrading to EA Pro.
Back to Top
Why does the Engine Analyzer Pro show that some Thermal
Barrier Coatings reduce performance?
Coatings which reduce friction should always help performance. Coatings which
reduce temps on the intake port/runner should always help performance by keeping
the intake charge cool and dense. However, coatings which reduce thermal
transfer to the piston or cylinder head do 2 things:
1) They reduce heat transfer (loss) which should help performance.
2) They usually increase the surface temp of the piston which should hurt
performance.
The total effect of both things determines if there is a net gain or loss.
Engine Analyzer Pro v2.1 "C" or later has an alternate coating choice
which reduces heat loss but doesn't increase the surface temp as much. Coating manufacturers.
say this is more typical of "modern coatings". Unfortunately, we don't
know which description of "modern" or "typical" is more
accurate.
Back to Top
Does the Engine Analyzer or Engine Analyzer Pro consider
Port Size (volume) when estimating Performance?
Yes, the Engine Analyzer Pro (and even the standard and Plus Engine Analyzer
programs) will show the effects of
large ports at high and low RPM. Both programs ask for port volume (or average
port diameter) for both the head and the intake manifold runner. Most other
programs don't ask for these details, but they are required for reasonably
accurate predictions. You will definitely see low RPM performance suffer when
ports get too big.
IMPORTANT: You can enter a very small or large port size, and the flow
settings for the port will not change, as they are a separate input. For
example, you can specify a 0.5" Average Port Diameter that flows 500 CFM,
which is impossible. SO, it is important that if you change port volume to also change port flow numbers to match this change.
How much the flow will change when you change port volume can typically only be determined on a flow bench.
Back to Top
My Turbo catalog only lists lb/min for airflow not cfm
as Engine Analyzer uses. Is there a formula to convert lb/min to cfm??
Multiply lb/min by 13 for an approximate CFM.
Back to Top
Can the Engine Analyzer and Engine Analyzer Pro be used
for small engines, like a 5 HP Briggs?
Yes, we have checked both programs against dyno runs from 5 HP Briggs
engines, and other small 4 stroke engines. The agreement is quite good, but we
haven't checked it as much as we have with typical V-8 dyno runs. Its just
that we've got a lot more V-8 dyno experience.
When HP and torque numbers are reported at very low numbers, they are
reported to the nearest .01 ft lbs and HP. Inputs like Bore and Stroke can be
specified to .001 ". The displacement is calculated with no rounding for
performance calculations. When displacement is displayed, it is rounded to the
nearest 0.1 CC.
Back to Top
The Spark Curve reported by the Standard Engine Analyzer
starts high, then drops down, then increases again. Is this possible?
The standard Engine Analyzer tries to make the spark curve somewhat
automatic. It gives the engine as much spark as the program thinks the engine
wants, but not so much as to let the engine detonate (spark knock) for the given
conditions (intake air temp, humidity, fuel octane, CR, etc.) The EA Pro is not
so automatic, but does give you much more freedom to try different things with
spark advance.
In the actual engine, spark advance curves have been developed from what a
simple centrifugal advance could do in an "old fashioned" distributor:
start at the "initial advance", then at some RPM start advancing to a
higher "full advance". This approximately follows what most engines
"want".
Most spark requirements increase gradually with RPM. However, if your engine
has a big cam, for example, it may produce poor low RPM torque (poor combustion
due to poor mixture) and may benefit from more advance until the engine gets
"up on tune", where spare requirements then fall, then pick up
gradually as RPM increases. Most of the time you really aren't interested in max
performance until the engine does get "up on tune", anyway, so don't
be too worried about spark advance at low RPM. Just be sure not to let the
engine detonate.
Another possibility is if the engine is Supercharged or Turbocharged, at low
RPM there is little boost so the engine can run a normal amount of spark. Then,
when boost starts to come on, the program "pulls out" spark advance to
avoid detonation. Then as RPM increase, spark can be put back in as detonation
is not as likely at higher RPM.
Please note that retarding the spark advance a few degrees from optimum
timing will not show a large loss in performance, but will give you a better
safety margin for avoiding detonation.
Back to Top
Do the Engine Analyzer's consider Turbo A/R in their
calculations? Do I alter the Turbo CFM rating to simulate different exhaust
turbine sizes?
Our Engine Analyzer v3.0 and Pro v2.1 both have specs that describe the
turbine (exh) side of the turbo separately from the compressor side. A flow map
describes the compressor, not the turbine at all. Turbo A/R does NOT affect the
flow map, but the turbine size, and how quickly (at what RPM) the turbo starts
to develop boost.
Back to Top
I have cam timing specs .020" lift intake and
.025" lift exhaust. Currently I am using the valve lift graphs to
determine where the .050" lift point is from where I see the .020" and
.025" lifts. Is there an easier way to figure this out?
I assume you mean that you have timing specs when the Valve Lash of .020 to .025
has been taken up and the valve just starts to open. That is what the program
calls seat timing. Just specify seat timing as the method of
rating events. However, seat timing is not nearly as accurate as
timing at .050", as explained below.
What you want is to have the program simulate the most important and largest
amount of the cam profile accurately. That would be duration at .050",
.100", .200" etc., the higher lifts. If you use .050" for rating
the cam events, this is done much more accurately, because the gradual part of
the ramps is over. You are already at the higher lifts.
Cam lift changes very gradually at the very beginning or end of the cam lobe
where seat timing is measured. For example duration at .001" could be
320 degrees. Duration at .002" for a cam with mild ramps could be 305
degrees, but for a cam with aggressive lobes could be 316 degrees. This allows
minor differences in cam lift aggressiveness to produce very different timing
figures.
Using the same seat timing events for 2 cams,
minor differences in design can produce totally different durations at
.050", .100", .200", etc. That is why the cam grinders adopted
the .050" cam lift point for comparing cams. It is much more accurate than
seat timing.
Also, remember, the Engine Analyzer graphs shows valve lift:
valve lift = tappet lift x Rocker Ratio - Valve Lash
or
tappet lift = valve lift / rocker
ratio + lash
Assuming .020" lash and a 1:1 rocker ratio, if you look for .025 lift on
the graph, you are getting cam or tappet lift at .025" + .020 , which would
be .045 inches cam lift. With a rocker ratio of 1.5, this would be a cam lift of
.025 / 1.5 + .020 = .037 cam lift.
Back to Top
How do I enter the weight of my crankshaft, pistons or
rods so I can see the effect on HP?
These weights do affect the rotating inertia of the engine. Rotating
inertia is an input in the Short Block specs screen, however currently there is
no way in the program to estimate the change in rotating inertia for rod or
piston weight changes. This is addressed in our Rotating
Inertia Calculator program, and may be included in Engine Analyzer Pro
updates.
Rotating inertia only affects power when the engine is accelerating, like in
a vehicle when it is accelerating or on a dyno's accelerating
("sweep") testing, say at 300 RPM/sec. Then some of the engine's
power must be used (lost) to accelerating the engine's own internal
inertia. The lower the inertia, then the less power lost.
People often think that because a piston is lighter, it takes less of the
engine's power to accelerate it down from TDC. That is true, but what they
forget is that energy is recovered when the piston is decelerated when it again
approaches TDC. Therefore there is no net loss when running steady state
dyno tests. (Note that there could always be some secondary effects on
performance that are very difficult to model. These could be things like
lighter pistons don't stretch the rod as much, therefore things like compression
ratio or ring seal is maintained, or lighter pistons "rock" in the
bore differently as they approach and accelerate from TDC, thus sealing or
friction could be slightly different, etc.)
Then you may ask "Why do engine builders strive to use lighter pistons
and rods?" That's because lighter pistons and rods put lower stresses
on the rods and rod bolts. Lower stresses mean longer durability and/or
you can rev the engine higher. With proper choice of cam, Head Flow, etc.,
most anything that lets rev the engine higher will produce more HP.
Back to Top
What is the formula for determining Intake Valve
Closing angle in the Compression Ratio Calculator?
The "Formula" is quite complex (many formulas actually) and has
to do with our Cam Profile Designer routines. At .050 tappet lift, the
valve may still be .100 " off the seat (not closed). For Dynamic
Compression ratio you want to know when the valve is ON the seat so pressure
will start to build in the chamber, which changes with profile type, Hyd vs
Solid Lifters, Lash, etc. for a particular intake closing at .050" tappet
lift. If you know the intake closing at .000 valve lift (seated timing),
you should enter it directly. (The .006" lash point is used for
hydraulic lifters because they are assumed to have about .006" effective
lash.)
Back to Top
Why does the Engine Analyzer and the Engine
Analyzer Pro give different results for detonation (spark knock)?
The 2 programs work differently:
EA30 retards spark to not allow detonation to occur. EA30 does not report
detonation level, just spark advance.
EA Pro runs the spark curve you give it or one it believes will produce best
power and just reports the detonation level.
Behind the scenes, the 2 program's calculations are quite different, especially
how they determine detonation levels. As we say for both, you can not use
the absolute levels of detonation (or spark curve in EA30) to tune your engine,
just use them to see trends. This cam or CR will produce about this much
more or less detonation.
Back to Top
Why is there a dip in the torque and HP curve at 3500
RPM?
All highly tuned engines with high overlap cams will encounter good and bad
tuning peaks through their RPM range. See Appendix 3 in user's manual
"Intake and Exhaust Tuning". For header primaries from 30-40
inches long, a "bad peak" for exhaust tuning comes around 3000-5000
RPM, where you will see a "dip" in the power curves. This is NOT
an indication of bad performance, just a "necessary evil" to get good
tuning and performance at other RPMs. If you try to eliminate this dip
(close up overlap), you will hurt performance at other RPMs. You can move
where this dip occurs by changing header primary length. For example,
going to longer primaries will move the dip to lower RPMs.
Back to Top
How do I build
an engine to run a certain quarter mile ET and MPH?
You would need both an Engine Analyzer (std, Plus or Pro) and Drag Race Analyzer
(std or Pro). The Engine Analyzer builds the engine and shows the torque and HP curves. The
Drag Race Analyzer takes the power curves and couples it with vehicle specs to come up with ET, MPH, etc. You can
Auto-link the 2 programs so that each time you make an engine mod in the Engine Analyzer, the ET and MPH (and 60 ft, finish RPM, etc) from the
Drag Race Analyzer are also displayed in the Engine Analyzer results.
Back to Top
How can I speed up the
Calculations in Engine Analyzer Pro?
The Engine Analyzer Pro's calculations are VERY detailed and do require a
significant amount of time to perform accurately. Some things which will
speed up the calculations include:
- Use a fast processor computer. Note: At this time we can not
take advantage of Dual Core Processor computers.
- Run as few RPMs as possible. This means using large RPM increments
(500 RPM or larger). Also, start at a high RPM. Low RPMs are
VERY time consuming, especially if the engine is unstable at those RPMs
(high overlap cams).
- Click on Preferences, then Calculations tab. Set the Calculation
Repeatability to "Standard".
- Use "Simplified Collector" in the Exhaust Specs as the
"Detailed Collector" takes more time.
- Turn off Valve Train Dynamics in the Cam/Valve Train Specs screen.
- Use the "Chain Calculation" feature to run through several
calculations unattended (like overnight). Then investigate the best 5
or 10 combinations for further refinement.
Once you find some promising combinations, you can go back to smaller RPM
increments, turning ON valve train dynamics, etc. and do more refinement.
Back to Top
I've run the same
exact conditions and the Engine Analyzer Pro does not give the exact same
results. Why?
The first thing you must understand is there is NO exact
answer. Each torque, HP, spark advance, etc result at each RPM is an
approximation. The calculation method for complex systems like an engine
is an iterative approach to problem solving, and it is the only way it can be done.
This involves assuming certain conditions going in, see what the answer is and if the results confirm your assumptions were
close enough. See Appendix 2 in the Engine Analyzer Pro user's
manual for more explanation.
If you watch the Tuning Pressures graphs during the calculations, you see each cycle's pressure waves. These waves are
NOT exactly the same from cycle to cycle for the same RPM and
conditions. The program must decide when to stop the calculations after the cycles appear to repeat
"good enough", within a tolerance, maybe within 0.5%. This tolerance can
NOT be zero difference for an exactly repeatable answer, or you will
NEVER get an answer.
The graph below shows the Intake Port Pressure waves for the exact same
engine at 8000 RPM. If the pressures were EXACTLY the same, you would only
see the green line. Because they are slightly different, you can see the
blue line also underneath the green line. The test with the blue line
showed 908 HP at 8000, the green line showed 910 HP. (Remember that there
is more affecting these results than just Intake Port Pressure. Exhaust
Port Pressure, burn rate, heat transfer, etc all have an effect on the end
result of 908 vs 910 HP.) However, in both cases, the
"tolerance" for an acceptable answer was met. The difference of
2 HP our of 910 HP is only 0.2%.
You should also understand that each cycle (cylinder firing) in the real
engine is not exactly the same as the last. Cycle to cycle variation of
IMEP (torque on top of the piston), can easily be 5.0 % or more. If you
just took, say 3 cylinder firings to get the torque at each RPM, you would get
VERY non-repeatable dyno runs. But because good dyno software averages out
hundreds of firings together, you can get repeatability of 1.0 % or better,
which is still not nearly as repeatable as the Engine Analyzer Pro.
Even our smaller Engine Analyzer programs use this iterative approach.
However, their calculations are not nearly as complex so you do get almost
exactly the same answer for each particular engine condition.
Notes on Repeatability:
Engine's which are less repeatable are those with high overlap cams, high
specific output (high HP/cubic inch) and turbochargers.
To improve repeatability, increase the "Calculation Repeatability"
under the "Calculations" tab in the Preferences section. This
will make the calculations take more time, but will improve repeatability.
Back to Top
What should I adjust to get the
Engine Analyzer results (std, Plus or Pro) to match my real dyno results?
The Users Manuals for both the standard, Plus and Pro versions talk about
this in Appendix 4 in each. Click on the blue links below for either
manual:
Do not adjust some input spec which you know for sure. For example,
you may find that reducing the head flow 20% will make the program match the
dyno results. But now the program will show a bigger improvement in
performance from a bigger cam than the real engine would show on a dyno.
That's because the program sees the heads as being more restrictive, and a bigger cam
improves the overall flow significantly. The real difference could be that the dyno
calibration is low or high, the dyno has a different amount of accessories it's
driving on the front end, etc.
You should enter all the numbers you know for sure, accurately. Then
just accept the difference in the results. This way the program can better
predict the change
in performance from an engine change (modification). Remember, dynos vary in the
results they report, especially chassis dynos which can be 15-25% lower than an
engine dyno. The Engine Analyzer Pro lets you enter a chassis dyno
correction factor to reduce the output to match a particular dyno. Also,
the Engine Analyzer programs predict the results you would expect to see on an
engine dyno doing a step test, unless you have specified otherwise in the Engine
Analyzer Pro.
Back to Top
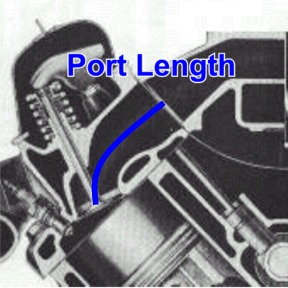
I'm a little confused about
measuring Port Length. Is it measured along the short side of the port?
Port length is measured from the center of the port at the mating surface to
the manifold (or header on the exhaust side) down the middle of the port to the
valve. This picture may explain it best.
Back to Top
How can I export the
cam profiles and cylinder flows and pressures from Engine Analyzer Pro to Excel?
The Engine Analyzer Pro produces what we call RPM Data like
torque, HP, fuel flow, BSFC, etc at each RPM of the run. It also produces Cycle
Data which are things like cylinder temperature, cylinder pressure,
piston thrust on the wall, intake valve lift, intake valve flow, etc at every 4
degrees of crankshaft rotation. (Behind the scenes the data is being
calculated at something more like every .1 degrees, but we only report it
at every 4 degrees.)
This Cycle Data is one thing which really sets the Engine Analyzer Pro apart
from other simulation programs. You can graph it and gain tremendous
insight into the internal workings of your engine. However some people
want to export it into other programs like Excel (tm) to do their own
analysis. The Engine Analyzer Pro provides several methods to let you
analyze and export this Cycle Data.
Shown below are some tips for producing Cycle Data graphs. Choose Cycle
Data graphs by clicking on the "rpm-CYC" menu option. If you are
currently doing RPM data, this menu option is shown as "RPM-cyc".
Then you have the choice of doing Cycle Data graphs of "MIXED" data
(from one to 4 different cycle data types on one graph like in the graph below
of Int and Exh Valve Lift) or just "SINGLE" data graphs (where you
pick just one data type from a list as shown below).
 (click image to enlarge it)
You can also use the "See-Engine" option at the top of the tabular
results. Click on "See-Engine" to bring up the Piston-to-Valve
Clearance screen. There you can watch the interaction of the valve lifts,
Piston Position, cylinder and port pressures and flows to truly better
understand what goes on inside the engine. There you can also click on
Options to bring up the See-Engine Options screen, where you can choose to
export Tabular Data of the data used on this screen to Notepad.
 (click image to enlarge it)
You can also use the "ASCII File" option at the top of the tabular
results. Click on "ASCII File" to bring up the Export ASCII File
screen. There you can chose most any RPM Data or Cycle Data to export to
an ASCII (text) file in various formats. This file can be imported to
Excel for most any analysis you wish.
 (click image to enlarge it)
Back to Top
How can I create a cam file to be read by
Engine Analyzer Pro or other Performance Trends software?
The Engine Analyzer Pro and many of our other engine programs can read a
detailed cam file, which typically contains a tappet lift for every cam degree
(every 2 crank degrees). These formats include Cam Dr (.c1), Cam Pro Plus
(.cpp), S96, Andrews, Comp Cams, to name a few. When you want to create a
cam file from generic data, like possibly Excel spread sheet data, you need to
create one of these files. Missing just one line of data, or missing a
comment line is enough to throw everything off. Therefore we will try to
explain the best course of action to produce a cam file.
First, the Comp Cams and S96 formats are the easiest to produce
from Excel or other text data.
Comp Cams format consists of 42 lines of comments followed by 360
tappet lift data points.
for an example file.
S96 format consists of 360 tappet lift data points followed by an
additional 36 lift points. These last 36 points are typically the same as
the first 36 points, but are used by some software to confirm the reliability of
the measurement. If these last 36 do not match the first 36 very well,
something is wrong with the measurements.
for an example file.
Cam Dr is a complicated and definitely not recommended.
for an example file to show you the complexity.
Our Cam Analyzer has many options for producing many different cam file
formats from various types of cam measurements, besides doing all sorts of cam
analysis of its own. Here's an example of how to import Excel or text data
copied to the Windows clipboard, and create a cam file.
Create a new file and be sure to have selected "Type of Cam Data"
as "Measured by Hand". To check this, click on the Test/Cam
Setup option at the top of the main screen. This type of data allows for
the most manual modification, including entering data by hand from degree wheel
and dial indicator readings.
 click image to enlarge it
If your file just has lift data, you need to generate some degree wheel
readings to match up to the lift data points. Click on the "Generated
Degree Wheel Readings" to generate several degree readings. If your
lift data is every cam degree, you will select "Crank Deg Steps" of 2
degrees (1 cam degree). The program limits you to 500 degrees, but that
should be plenty as the base circle should be 0 lift and that is what the
program will assume for the missing data from 502 to 720 degrees. If you
are clever, you will enter the proper "First Degree Wheel Reading"
point to coincide with the timing of the first lift reading. However, most
all Performance Trends products let you specify where you want the centerline of
the cam profile. So in the process of creating this file, if you are off
in timing, you can either use the Edit commands in Cam Analyzer to advance or
retard this data to get the proper timing, or specify the correct Centerline in
another program (like Engine Analyzer Pro) to shift the profile into the proper
timing.
 click image to enlarge it
Here's an example of S96 data read into Notepad that we will use as an
example of tappet lift data. Obviously if we already had the S96 file, we
wouldn't have to go through all this. Copy all this data using the Ctrl-A
(for selecting all lines of text) and then the Ctrl-C (for copying all the
selected text to the invisible clipboard). The Edit commands in Notepad
also let you do this.
 click image to enlarge it
Click the top of the Tappet Lift column (on the title "Tappet
Lift") and the Edit Text Data screen appears. Click on the big white field
to place the cursor there, and do a Ctrl-V (paste from clipboard) to paste the
tappet lifts from Notepad into that field. Then click the "Use This
Data" button to fill the Tappet Lift column with these readings. You
will notice lots of other Edit options on this screen, which are used if your
data has 2 columns of data, of both degree and lift readings.
 click image to enlarge it
Once you have pasted the tappet lifts, a cam profile is graphed, as shown
below. Other Edit options of Advance/Retard let you change this timing if
you want to. Click on File, then "Export as Cam Dr File (and other
formats)" for a new screen letting you create several different file
formats.
 click image to enlarge it
Back to Top
I don't know much about my
engine. How can I build an engine file for it?
Obviously we can not have an Example Engine file for every engine ever
produced produced. You can start with ANY engine to create your engine.
Click on File, then Open Example Engine file and pick an engine file
close to your engine. Starting with an Example
Engine file close to your engine will be the easiest since you
will not have to make as many changes. And, for those things you don't know,
leave the settings already in the Example Engine file. Then save your engine file to a name of your choosing, like "My
Mustang" by clicking on File, then Save As and entering a name of your
choosing.
Read Example 4.1 "I Don't Know my Engine's Specs" starting on page 151 in the Engine Analyzer's User Manual at link below:
https://performancetrends.com/PDFs/EAMAN4.pdf
Since that section of the manual was written, we've added thousands more example
parts. So, it should be much easier to get a file close to your engine
than even written in Example 4.1.
Also, get used to using Google or other
search engines to find info. If you need head flow data for, say, a 1990
1.6L Alfa Romeo engine, enter terms into the google search field like:
1990 Alfa Romeo 1.6L CFM
or Alfa Romeo 1.6L head flow CFM
If you need cam specs for the same engine, enter terms into the google search
like:
1990 Alfa Romeo 1.6L cam centerline
or Alfa Romeo 1.6L cam duration .050
Think of the words or terms you would see in an article describing the info
you are looking for. Google will open up a wealth of information for
building your engine models.
UPDATE: Now an even better option than a Google search is using
artificial intelligence or AI. If you are "computer challenged",
don't be scared of it. It's almost identical to a Google search, just much
faster and gets right to the info you want. Grok.com
is about the best. Click on the link and just enter a question, like
"What is the head flow in CFM at 28" for the 1962 Buick 215 aluminum
V8?". You will likely be amazed at how well this works.
to visit Grok.com
Back to Top
When
calculating Average Port Diameter, what do I use for the Port Length?
Our Engine Analyzer programs (and some others like Port Flow Analyzer) let
you calculate Avg Port Diameter from Port Length and Port Volume. The best
estimate of the Port Length is using a wire down the center of the port to the
top of the center of the valve if there were no valve stem there. There is
no way you can do this super accurate; an estimate within 0.25 inches (5 mm) is
sufficiently close. See picture below.
Back to Top
How do I use a .jpg file of a turbo compressor map for entering a detailed
map into Engine Analyzer Pro Enterprise Edition?
We call this feature "translating" a compressor map.
for a 3 page description of how this is done.
Back to Top
Why does the program show air flow of 600
CFM, but the carb CFM rating is 850 CFM?
People mistake at carb CFM rating with carb CFM flow.
A typical performance carb is rated at 1.5" mercury (20.4" water)
pressure drop. If you put more pressure drop across it, the carb will flow
more, less pressure drop it will flow less. When that 850 CFM carb is
setting on a bench to get worked on, it is NOT flowing 850 CFM. It is
flowing 0 CFM because there is
no pressure drop across it. If you watch the Intake Vacuum calculated in
the program for non-boosted applications, you should see the engine flowing
close to the carb's CFM rating when the Intake Vacuum is close to 1.5".
People are often surprised that a carb which is rated at a higher CFM flow
than what the program needs will produce more power. Like in the example
above, if you put on a 600 CFM carb, the power will likely drop even though the
engine is only flowing 600 CFM. The reason is because the 600 CFM produces
1.5" intake vacuum and the 850 CFM carb likely only produces 1.0"
intake vacuum. The engine has 0.5" less intake vacuum. That's
like having a free supercharger providing 0.5" mercury boost, or about 0.25
psi boost.
Now, at some point if you go too big, the metering signal to pull fuel
through the jets gets weak, and atomization gets poor, and air fuel distribution
between cylinders can get very bad. This will result in a power
loss. It is very difficult to predict when a carb starts getting too big
with a simulation program. The Engine Analyzer programs typically assume
good distribution and atomization unless things are obviously really bad.
Then the MxtrQlty number starts going down from 100%, typically just at lower
RPMs.
So, to summarize, the Engine Analyzer programs are calculating the
proper effect for carb CFM ratings until the CFM rating gets so high that A/F
mixture quality can start to suffer.
Back to Top
How do I measure the Intake
Runner Length and Diameter for my Individual Runner Weber carbs?
The Engine Analyzer programs use Intake Runner Length and Diameter to determine
the quality of the tuning pulses, which have a huge effect on engine
performance. Without these pulses, it would be near impossible to get a
naturally aspirated engine to produce more than about 90% volumetric
efficiency. With these runners properly sized on free flowing heads, you
can get up to 130% volumetric efficiency or higher.
Click on the picture below to see the difference between measuring an intake
manifold with a plenum shared by more than 1 cylinder, or an individual runner
system. As the definition in the manual states, it is the distance from
the head back toward the air cleaner to the first "abrupt
enlargement". With individual runner carbs or throttle
bodies, the runner basically extends from the port through carbs or throttle
body and any velocity stack to the "abrupt enlargement" of the opening
to atmosphere or a large air cleaner.
 click on picture to enlarge it
For Diameter, you want to obtain the average diameter over the
entire length. The most precise way is to cc the manifold, carb and
velocity stack. With the intake off the engine, block off the mating
surface for the head with a plate. Pour in a measured volume of water
until you fill the manifold, carb and velocity stack. With this cc volume
and the Intake Runner Length, use the "Clc" utility in the program to
calculate an exact average diameter. For example, the length could be 13
inches and the volume could be 335 ccs to produce an Average Intake Diameter of
1.41", as shown below.

Typically cc'ing is a lot of work. If you know the carb's diameter
where it bolts to the manifold, you can approximately adjust this number up or
down slightly knowing the rest of the components. Like in the picture
above, if the carb diameter is 1.50", the manifold tapers down slightly to
the head, the venturi in the carb also reduces the diameter some, but the
velocity stack increases the diameter. With these trade-offs, the
1.50" measurement at the carb base is a very reasonable estimate of the
Average Intake Runner Diameter. If one component is especially long, like
the velocity stack or manifold, then it's diameter would have a much bigger
effect on the Average Intake Runner Diameter.
Back to Top
What is the difference between
Designed Valve Lash and Actual Valve Lash?
Some of our more advanced programs which create cam profiles have 2 inputs
for the valve lash for solid lifter cams, Designed Valve Lash and Actual Valve
Lash. This gives you the ability to run different valve lash settings on
the same profile, which could have been designed for a different valve
lash than what you are running.
The picture below shows a cam lobe designed to run .026" of valve
lash. The Designed Valve Lash is .026". However, we ran it in
our Engine Analyzer Pro with 3 different Actual Valve Lashes of .010",
.026" (what is was designed for) and .040". You will see on the
opening and closing ramps at 0 valve lift, when the Designed and Actual lashes
match, the ramp is quite smooth. At a lower lash your follower will
"see" some of the typical constant velocity ramp which is designed to
take up the lash before opening the valve. At higher lash, the follower
starts on a much steeper part of the ramp. In both cases of not having the
Designed and Actual valve lashes match, it puts higher stresses on the parts
including possible higher side loading on the follower.
 click image to enlarge
Back to Top
How do I figure out how to
enter the information the Engine Analyzer Pro needs, for example for Bearing
Size Coefficient?
Because we know this about bearings (an many other inputs to the program), we have general ratings you can pick from in the drop down list with descriptions.
If you are not analyzing the effect of bearing sizes on performance,
these typical ratings work well and are easy.
 (click image to enlarge it)
If you ARE analyzing the effect of bearing sizes on engine friction,
you will want to calculate a more exact Bearing Size Coefficient for the engine
as it is now, and what you are thinking about doing. Then you can click on
the "Clc" button to bring up the Calculation Utility screen shown
below.
 (click image to enlarge it)
Bearings (for example cam bearings) typically are all slightly different
diameters and possibly widths, so you will have to estimate a good average for
the inputs. As you change your inputs, the Calculated Bearing Size
Coefficient changes at the top of the screen. So you can see what this is with an input on the higher
side of a reasonable estimate for bearing sizes, then on the lower side of a reasonable estimate.
Or to be more precise, run the entire performance calculation with both
estimates. If there is hardly any change, your estimate for the inputs is
close enough. If there is significant change, this is something to investigate further.
So you may think, why do we ask for this amount of detail. It's not that we need it for estimating performance. BUT, if these inputs were not available, you could not see the effects of these more minor types of
engine modifications.
Back to Top
EZ Flow and Port Flow Analyzer Questions
If I build an
EZ Flow flow bench just using a shop vacuum as the flow source, how will that affect my data?
A SuperFlow tm 600 has 8 vacuum motors about the size of the motor in a typical shop vacuum cleaner.
You will not get the same flow from 1 motor as you do from 8 motors.
We estimate these motors can deliver from 60-80 CFM once fitted into a flow bench or one of our
EZ flow systems. This is less than the motor specs may show, but that is because you need flow
to overcome the restriction of the measurement orifice (typically 10" water in our EZ Flow System,
or more in larger SuperFlow benches) and other losses. Each of these motors will
require about 10 amps at 110 VAC or 5 amps at 220-240 VAC if you wire 2 in series. There are
similar motors designed specifically for 220-240 VAC.
Vacuum motors also come with different number of stages, 1, 2 or 3. The more stages, the more
pressure drop you get, but likely slightly less flow. Typical shop vacuums are 1 or 2 stages,
but Superflow motors are all 2 stage motors. A 1 stage vacuum motor is unlikely to produce more
than 20" water pressure when fitted in a flow bench.
For example, if you have a typical, "healthy" small block Chevy head which can flow about 300 CFM
at 28" pressure drop. At only 10" test pressure, it will flow about 170 CFM. One single stage
shop vacuum is likely to produce about 20" pressure when the valve is at low lift and drop off
to only 5" to 7" water at high lift for this head.
The Port Flow Analyzer will ask you what test pressure you want to test at, like 10 or 28" water.
This is designed to make small corrections, like you were actually at 27.85" and the program
corrects to what it would be at exactly 28". If you are at only 5" to 7", the correction done
by the software can not be as accurate. For example, if you measure at 5" and correct the flow
to what is should have been at 28", it could very likely be 20 CFM or more different than if
you actually measured it at 28".
The more important problem could be that a port modification which produced a small improvement
in flow found when flowing at 5", could actually hurt flow if you were flowing at 28".
Now, there is nothing magic about 28" water. Smokey Yunick did some significant
work on air flow many years ago, and picked this pressure (about 1 psi) as what he thought was reasonable, and it stuck.
It is now the industry standard.
It is not like a running engine produces 1 psi of pressure across the valves. When the exhaust valve opens, there can be over
1000 psi pressure, and both valves can have reverse pressure so the port actually flows in the
reverse direction.
for info on some of Smokey's work on why we flow at 28" water.
Source: Allen Roberts, Starting Line Products, Idaho Falls, ID Many
thanks Allen.
for our blog entry discussing why we flow at 28" water.
Pressure across intake valve in running engine (with more
graphs in blog entry)

So, what does all this mean?
-
If you want to duplicate what most head porters are doing, you want to actually measure flow at 28" water. Many motorcycle head porters flow at 10" water because
of the popularity of the older SF110 bench in the motorcycle market.
- One shop vacuum will produce very low test pressures at higher flows. The Port Flow software
can correct this to be close to what the head would flow at 28".
- The more vacuum motors you use to obtain higher flows, the more amps or
electrical power you will need.
Back to Top
My EZ Flow
System shows I have significant amounts of leakage when I have my valve
closed. Why?
The EZ Flow system is a single range flow bench. It uses an orifice to
measure flow, the same as a SuperFlow tm bench like the SF600 tm,
the industry standard. A SuperFlow 600 tm has several ranges
for measuring flow, which has advantages, especially when measuring very low
flows.
The picture below shows the flow measuring inclined manometer of a SuperFlow tm
bench. You will see that it is very non-linear. This means that a
certain change in pressure could be a 10% change in flow at very low flows, but
only a 0.5% change in flow at the higher end of the scale. For this
reason, the best accuracy is obtained when the flow pressure is above 30% of its
full scale flow.
 click image to enlarge it
When you leak check, any small amount of electrical variation in the flow
pressure sensor will indicate some flow. Because of the very non-linear
nature of the relationship between pressure and flow when close to zero flow,
the flow it indicates can be very high, much higher than is truly
happening. For example, a .01 volt change (like .40 to .41 volts with .40
volts indicating zero flow) could indicate a 3% flow reading. If your EZ
Flow is fitted with a 3" diameter flow orifice (400 CFM range), that 3%
flow could be 12 CFM flow reading. At the more accurate higher end of the
flow range, .01 volt change (like 4.50 to 4.51 volts) would only be 0.2 CFM
change.
For this reason, it is not recommended you try to measure leakage flow with
the EZ Flow system. Be very careful with your test setup and always assume
zero leakage. To do leakage accurately you would need to use a much
smaller flow orifice, but in the process of changing flow orifices you could
easily change the leakage value.
Back to Top
Does my flow bench
require corrections for weather changes?
Many people think flow bench data needs to be corrected for weather changes
because engine dyno data is corrected for weather. Here's some things to
know:
You typically do not need weather sensors or weather corrections
because flow benches deal with volume flow, not mass flow. Engine performance on dynos is affected by air mass flow, so they need corrections.
With our EZ Flow system, we are basically comparing 1 unknown hole (the cylinder head or test piece) with a known hole
(the orifice inside bench) with the same quality air. Because of this method of measuring air flow is pressure drop across a restriction, no weather corrections are required.
In simple terms, we are comparing apples to apples.
Some flow benches place the blower motor between the test piece and the
measurement orifice, we call a "blower center bench" on page 12 of the
Port Flow Analyzer
user's manual. In these cases, the air temperature can be different
flowing through the test piece and the flow orifice, having been heated by the
blower motor. Then you need to do a correction for the temperature
difference.
Some benches measure air flow with a different method than pressure drop across an orifice, like
a hot wire anemometer, Laminar Flow Element, pitot tube, etc. These type
of benches sometimes do require some correction for weather,
because in these benches you are comparing apples to oranges.
Back to Top
How do I copy my
program from an old computer to a new one?
There are several ways to do this. The most universal way is to copy
the complete folder from the old computer to a CD or memory stick (zip
drive). This is done without the Port Flow Analyzer running. Right
click on Start in the lower left corner, then select Explore. On the left
side of the new screen, look for the C: drive (sometimes called Local Disk C:)
and double click it. On the left side, now look for Program Files
folder and double click it. (For Win 7 and Win 10 this may be Program
Files (x86).)
For v3.5 Port Flow Analyzer, look for Performance Trends folder and
double click on it.
For v3.5 Port Flow Analyzer, look for Port Flow Analyzer v3.5 folder
and right click on it and select Copy.
Now find your memory stick or CD drive on the left side of the screen, right
click on it and select Paste. You have now copied everything from
your old computer to your memory stick or CD. This is an excellent way of
making a backup of all you data also.
Now go to your new computer and insert your memory stick or CD. Again,
this is done without the Port Flow Analyzer running. A message may
come up automatically and you want to "Browse" the memory stick or
CD. If not, Right click on Start in the lower left corner, then
select Explore. On the left side of the new screen, look for the yellow
folder Port Flow Analyzer v3.5. Right click
on it and select Copy.
Now look for the C: drive through the same screen from where you Copied the
folder. You may have to go up a few levels. When you find the C:
drive (sometimes called Local Disk C:), double click it. On the left side,
now look for Program Files folder and double click it. (For Win 7
and Win 10 this may be Program Files (x86).)
For v3.5 Port Flow Analyzer, look for Performance Trends folder and
double click on it.
For v3.5 Port Flow Analyzer, right click on Performance Trends
folder and select Paste. It may ask you if you want to
overwrite some files and say Yes.
Now install the Port Flow Analyzer program to your new computer to the
default location (where it automatically wants to go). When asked, select
to do a Refresh installation instead of a Complete (typical) installation.
Now you should be able to start your new Port Flow Analyzer installation on the
new computer by double clicking on the desktop icon and all your old test
files should be there.
Resetting your Master Flow Bench Specs: To get your flow bench
settings and calibrations back, you need to reload the Master Flow Bench Specs.
In the Port Flow Analyzer program, open one of your old tests which you know represents how your
flow bench is configured today, a recent good test. Click on Flow Bench at the top of the main screen. Once inside
Flow Bench Specs screen, click on File (at top) then Save as Master Flow Bench Specs. Click on Back to return to the main screen.
Now you should be ready to start testing again.
-----------------------------------------------------------
An alternate way (if you have v3.5 or newer on both computers) is to click on
File (upper left corner of main screen), then Backup Flow Tests
and follow program instructions.
Install the Port Flow Analyzer program to your new computer, and start the
program. Click on File (upper left corner of main screen), then Restore
from a Backup, then Restore All Backed Up Tests and follow program
instructions.
Back to Top
How do I share data files on
a hub (network with shared folder on server and clients)?
for more updated info on this topic for newer computers, like Windows 10
Some of our more advanced programs have a preference where
you can store your data files in a different location. The example of how
to do this is given below for our Port Flow Analyzer software.
Assume you want to share your Port Flow Analyzer files on 2
different computers, one called the Shop Computer and one called the Office
Computer. We will assume that the
Office computer is where you want all the new files you create to be stored.
This is the procedure to follow:
1.
Install and activate the Port Flow Analyzer on both computers.
2.
Using Windows Explorer, set up the Port Flow Analyzer folder (
PFA30 for v3.0 and Port Flow Analyzer v3.5 for v3.5
) on the Office computer to be shared. Usually
this is done by right clicking on the
PFA
30 or Port Flow Analyzer v3.5 folder (usually under the PerfTrns.pti folder on
the C drive for v3.0, or Performance Trends folder under Program Files
or Program Files(x86) for v3.5)
and selecting the Sharing option. If
you don't see Sharing, click on Start, then Help and look for help on Sharing
Resources.
3.
Map the Shared
PFA
folder on the Office Computer to the Shop Computer.
On Win Me, this is done by right clicking on My Computer and selecting
Mapping Network Drive. You should be
able to select a drive letter and match it up with the shared resource from the
Office Computer. It could be the K:
drive for the
PFA
folder. You will probably have an
option to allow this to always be mapped on startup, something like "Reconnect
at Logon". This is the easiest,
but it can slow down your Shop Computer's system.
If you don't see Mapping..., click on Start, then Help and look for
help on Mapping or Network Drives, etc.
4.
In the
PFA
program in the Shop Computer, set the Preference to Yes for Use Alternate File
Location. Then type in the path to
the Mapped drive from the Office Computer, perhaps K:\
PFA
. You can use Windows Explorer to
see this location, by expanding the Drive of Network Places or Network
Neighborhood. Later versions of Port Flow Analyzer have a Browse button to
do this. NOTE: It is important that there is no slash
"\" at the end of the path. Later versions of Port Flow
Analyzer get rid of a slash automatically.
5.
Now, when both computers are running, all your flow files, engine
and head spec files, etc are being opened from and saved to the Office Computer,
both for the Port Flow Analyzer program on either the Office Computer or the
Shop Computer.
Update: Newer versions of Windows, like Windows 10 can present some
additional problems. Instead of the letter for the drive, like the
"Z:" drive shown below, you may have to enter the shared
"name" of the drive, like shown in the 2nd picture below. The
3rd picture below shows how this same drive looks when identified in Windows
File Explorer.

for pic of "Path to Data Files" as a letter drive
 for pic of "Path to Data Files" as a drive name
 for pic of how this drive looks in Windows File Explorer
for more info on this topic (possible problems sharing files) on the web
for more updated info on this topic for newer computers, like Windows 10
Back to Top
I lost the power supply for my
Black Box II. Can I get one at Radio Shack?
You can get a replacement power supply from us at a nominal
charge. If you need something right away, here are the specs for most all
our Black Box II, DataMite III USB, and DataMite Mini USB loggers: 12 volt
DC, 300 mAmp minimum, 2.1mm center pin diameter, 5.5 mm barrel OD, and most
importantly: center positive. If you are not sure what these specs
mean, purchase one from us.
Back to Top
My Black Box
II readings do not exactly match my manometer readings at some points.
What can I do?
For most users, a flow bench is a comparator to see if the flow is improving
or not. So, if the electronics reads, say, 1% low at some flows it always
reads the same 1% low. If you make a 5% improvement in flow in that flow
range, the bench still reads it as a 5% improvement.
For various reasons, 2 sensors reading the same thing (pressure, temperature,
etc) do not always read the same. If you assume your flow manometer is
correct (and that can be a big assumption), you may want the electronic reading
to exactly match the manometer at all readings. The Head
Porter version of the Port Flow software has a feature called "Fine
Tuning" that can do this. It is somewhat involved and too long for
this FAQ page, but is explained in the link below:
to read how to "Fine Tune" your Flow Sensor.
Back to Top
My Flow Bench readings seem
erratic or inaccurate, even based on my manometer readings. How can I
troubleshoot this?
Many times erratic flow bench readings can be caused by problems with the
hoses which provide the pressure readings to the fluid manometers and/or
pressure sensors for the flow bench electronics like Performance Trends Black
Box II or the SuperFlow Flowcom.
to read how to "Troubleshooting Flow Bench Hoses"
Back to Top
Besides
CFM Flow, what can I measure on a flow bench?
Most people think flow benches can only measure head flow, and produce graphs
of CFM vs lift. But with the proper tools from Performance Trends, you can
learn a lot more about your heads.
to read the blog post "Besides CFM Flow, what can you measure on a Flow Bench?"
Back to Top
Why won't my automatic valve
opener find the tip of my valve?
One of the most common problems encountered with the automatic valve opener
is that the square body of the valve opener is not grounded to the valve you are
testing through
the head. The way to check this is with an ohm meter. Check the ohms
of resistance between the square body and the tip of the valve, when the opener
is mounted on the head. Place 1 probe on a screw head on the square body,
and the other on, say, the intake valve tip (or stem) when the valve opener is
retracted off the valve tip.
If it is more than about 50 ohms or so, you probably need a better way to ground
the valve opener to the head. The picture below with the black wire shows
1 method of correcting this problem.
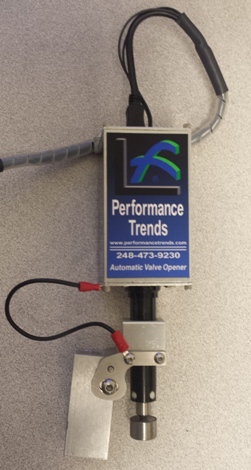 for a PDF with more info
for a movie
for a PDF with more info
for a movie
Back to Top
What
can I check on my Electronic Velocity Probe to see if it has a fault?
Disconnect the Electronic Velocity Probe's 4 pin connector. Set a
digital volt meter to read ohms of resistance. With the locking tab at the
top, measure the resistance between the 2 male pins at the bottom of the
connector. It should read within about 4 ohms of 100 ohms.
 click image to enlarge
To test the remote tip, measure the resistance between the 2 female sockets
in the connector. Again, it should read within about 4 ohms of 100 ohms.
 click image to enlarge
If it is not within this range, contact Performance Trends with this
information.
Another thing to check: The Electronic Velocity Pro requires 12 volts
to operate. Be sure you have the 12 volt DC power supply plugged in and it
is producing at least 11 volts DC. This power could plug directly into the
probe's cable (on FlowComs), or the USB Logger for Performance Trends' USB Black
Box.
Back to Top
Are
the Electronic Velocity Probes as accurate as the traditional pitot tubes?
No velocity probe is exactly repeatable from day to day. Weather and temperature conditions, how you hold the probe, the exact position of the probe, etc all effect the readings.
That being said, the standard pressure style pitot tubes are more repeatable from day to day. The electronic velocity probes can drift some from day-to-day, but their small size advantage greatly make up for this drift.
For example, say the electronic velocity probe reads 10% higher today than
yesterday, which is more "drift" than is likely to occur. It still will show that position A in the port is reading 50% higher velocity than position B. That is really what you are interested in, is where are the high and low velocity areas in the port or around the valve.
Check the graph below, where the one on the right has readings 10% higher
than the one on the left. Both graphs show that the velocity at the 12:00
position is MUCH higher than the rest of the valve, about 210+ ft/sec, and the
flow drops quickly at both the 3:00 and 9:00 positions, to about 60
ft/second. Then at the 7:00 position it increases back to about 120
ft/second.
 click image to enlarge it
Considering that this type of detailed testing is not even possible with
conventional pressure style pitot tubes, the electronic velocity probes are the
clear winner even if they can drift some.
Back to Top
I'm having trouble understanding how to get my Valve Opener to work with
my SF1020 to automatically do a flow test. Can you help?
 The Automatic
Valve Opener works best when the flow ranges you will use for your test are
already set up in your Port Flow Analyzer. Then the
software can do the range changes as necessary and set the correct valve lifts
you have scheduled.
The Automatic
Valve Opener works best when the flow ranges you will use for your test are
already set up in your Port Flow Analyzer. Then the
software can do the range changes as necessary and set the correct valve lifts
you have scheduled.
for a PDF with more info
Back to Top
We flow components
like air cleaners at different test pressures. Can the Port Flow Analyzer
do this?
Yes, there is a Preference setting in the Pro or Head Porter versions to turn
on this feature in your Port Flow Analyzer.
 click image to enlarge
and check pages 171-172 for details in the Port Flow Analyzer manual.
Back to Top
How
do I adjust my Port Flow Analyzer to match the CFM from a calibration orifice
plate?
The best way to see if your flow bench is reading correctly is to put an
orifice of a certain size where the cylinder head would normally go. An
orifice plate of a certain size should flow a certain CFM at a certain pressure
drop. For example, a 1.875" orifice plate (typical SuperFlow orifice
plate) should flow 247 CFM at 28". Contact Performance Trends for
ordering orifice plates if you don't have one.
If you run this check and you are not close to the CFM you should be, you can
correct the Port Flow Analyzer software to be more correct. For example,
say you are on Intake Range 4 on you SF600 bench. You flow your
calibration orifice and it reads 241 CFM when it should read 247 CFM. The
full scale range for Intake Range 4 in the Flow Bench specs is 299. So to increase
the reading from 241 up to the correct 247 we will need to increase
the 299 to something bigger. But how much?
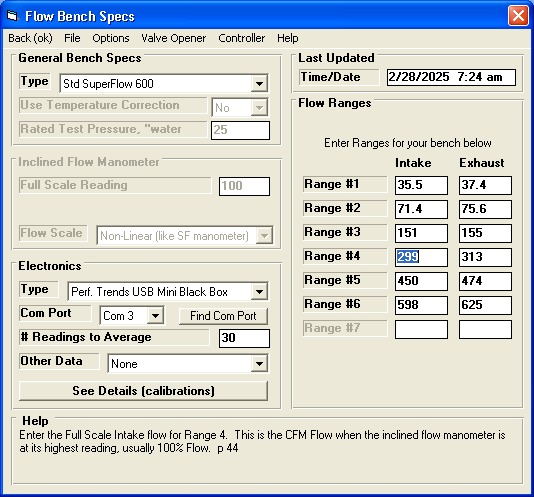
You must increase the 299 by a factor, a factor based on...
Factor = Orifice Plate Rated CFM / CFM
Reading = 247 / 241 =
1.025
Because this reading should increase, this factor should be
greater than 1, and it is. Multiply the Full Scale 299 CFM for Intake
Range 4 by 1.025.
New Full Scale CFM = Current Full Scale CFM x
Factor = 299 x 1.025 = 306
So replace 299 with 306 and your readings on Intake Range 4 will all be 2.5%
higher.
Notes:
Before you do this, make sure your manometers are working accurately and are
reading 0 when the bench is off (no flow). If you have electronics, make
sure they are matching the manometers or the pressure sensor calibrations are
accurate and read 0 when the bench is off (no flow). The Port Flow
Analyzer let's you re-zero the pressure readings, under Options on the
Electronics or Flow Com screen for taking readings.
You should do this for each range you use, intake and exhaust.
It is recommended you only do this carefully one time, like when you first
get a Performance Trends data logger, or you have made a major change or just
got to your flow bench. Do NOT do this all the time as you will produce a
condition called "over correction" and your readings will be less
repeatable and you will waste time. You can check things with the
calibration orifice plate, and if the reading is close to what it should be,
leave the flow bench specs alone.
Orifice style flow benches like the SuperFlow benches and the Performance
Trends' EZ Flow are not affected significantly by weather changes, so you don't
have to recalibrate your bench if the weather changes.
If you are finding you need to make more than, say, a 10% change (a factor
less than .9 or greater than 1.1), check what you are doing. It is
unlikely the bench is off or has changed by more than 10%.
Even a slight amount of manometer fluid getting into the pressure lines of
the flow bench will cause major accuracy and repeatability problems. Check
for this if your calibrations are off by more than 10%.
Back to Top
Does the Port Flow Analyzer and the Black Box
logger work with PTS flow benches?
Yes, our Port Flow Analyzer and Black Box can be configured to work with most
any type of flow bench, production benches or DIY benches like the PTS.
for a PDF showing how to make connections to the PTS flow bench
Back to Top
Cam Analyzer / Cam Test Stand Questions
How does the software
know my cam timing when I measure the cam on the Cam Test Stand?
When you measure a cam on a stand, you don't know how the cam will be
installed in the engine. Typically you will tell the software something about the cam, like #1 Intake centerline is
at 110 deg. Then you measure that lobe and that info indexes the rotary encoder.
The #1 intake will have exactly a 110 deg centerline. All other lobes are indexed from that, like #1 exhaust centerline measures to be 106.4 deg, or a 108.2 deg lobe separation.
When you measure #2 intake, it will likely be slightly different than #1 due to
manufacturing tolerance, like 109.63 degrees.
Here's an example of the Lobe Comparison report when #1 intake centerline was
indexed to 102 degrees.

Now, if you KNOW where a keyway or dowel pin is located, you can measure that
location with the universal flat and Plus version of software. Then after measuring that you tell the software this dowel pin is exactly at,
say, 44 deg after TDC, and that will index the rotary encoder. Then you can measure the lobes based on that info.
It is important to note that unless you KNOW this keyway or dowel pin
location, do NOT make any assumptions. Aftermarket cams rarely have
predictable timing locations. That is why they recommend you check cam timing
after the cam is installed. If you are measuring production cams, like
checking cams from a factory, or doing tech inspection, you probably DO
KNOW where this location is and
can use this method to index the rotary encoder.
Back to Top
How do I
convert a cam file (CPP, S96, Cam Dr, etc) to a manufacturing type file (.p, .igs,
.iges, X/Y, etc) for a CNC cam grinder.
First, you need the Cam Analyzer Plus and Cam Grinder versions of the Cam Analyzer to do
this. However, you do not need our Cam Test Stand if you have the file in
some other type of computer file format, like Cam Dr, S96, Cam Pro Plus CPP,
etc). The v4.3B has several new features for making this process
easier. See below.
for a step-by-step procedure starting with a CPP file and creating an X/Y file
and an .iges
file which can be read by various CNC software.
for a newer step-by-step procedure starting with an S96 file (but could be
other file formats, including a Cam Analyzer file) and creating a
solid, 3D .iges
file by 2 different methods which, can be read by various CNC software.
for the v4.3B Supplement which describes several new features to make this
process easier.
Back to Top
I have a cam profile in
Excel and I want to use it in my Cam Grinding machine that has large grinding
wheel. Can Cam Analyzer make that conversion?
NOTE: The version 4.3B has new, more accurate features to do this
conversion for Berco, Van Norman, and other similar cam grinders.
See link below.
First, you need the Can Analyzer Plus and Cam Grinder versions of the Cam Analyzer to do
this. However, you do not need our Cam Test Stand if you have the file in
some other type of computer file format. In addition to the computer file,
you will need to know:
- Base circle of the cam
- Radius of the probe or roller follower used for measuring the lift file
you have
- Diameter of the grinding wheel on the cam grinding machine, typically
10-20 inches (200-500 mm) or so.
for a step-by-step procedure (including picture below) starting with an Excel file and creating a .csv
file which can be read with Excel after the conversion.

for the v4.3B Supplement which describes several new features to make this
process easier for Berco, Van Norman, and other similar cam grinders.
Back to Top
How do I create a
manufacturing file to exactly copy of a cam lobe I just measured?
You need the Cam Grinder version of the Cam Analyzer to do this. First
you must measure the cam using the Virtual Follower option, available via the
"See Virtual Follower Details" button in the Test/Cam Layout screen,
as shown in the screen below.
 click image to enlarge
You can use either the .750" diameter Universal Roller or the linear
encoder's standard tip directly on the cam lobe. The critical specs to set
are the Base Circle you will measure from the cam you are measuring, specifying
one of the Virtual Follower "Follower Types" (recommend Virtual
Roller), and the Probe Radius you are using.
 click image to enlarge
Then measure the lobe you want to duplicate with the Cam Test Stand.
When you have the lobe measured, click on File at upper left of main screen, the
Export Manufacturing Style File from the list.
 click image to enlarge
In the Export screen which comes up, choose IGS as the file type at top (or
one of the others if you are sure you can use that type), the file name, file
destination and which Lobe to Use (the one you measured). Then click on
the Make File button. IGS is the Format recommended because many CAD/CAM
programs like SolidWorks and Mastercam will import it directly.
 click image to enlarge
A portion of the resulting IGS file is shown below in Notepad below.
 click image to enlarge
to view the entire file.
Back to Top
Can I figure out how much to reduce the base circle for regrinding an
existing cam for larger lobes and lobe separation?
to review a related FAQ: Can I create an XY or polar angle/length file for roughing out a cam on my
CNC from .050" duration and max lift data only? Many of the steps
in that procedure will be used for this FAQ.
We will assume you have a customer with an existing cam similar to the cam in
the FAQ below, with 110 deg lobe separation, .380 lobe lift, and 235 deg
duration at .050" lift. You can either create a generic profile from
simple .050" specs (like FAQ below, and simpler) or by measuring the actual
cam (more time consuming but slightly more accurate). However, the
critical aspect of the profile is that it includes Absolute Lift, so that the
lift on base circle is half the base circle diameter. For this FAQ, we
will assume you've created the original cam file from .050" specs like in
the FAQ below.
Next we will assume the customer wants you to regrind this camshaft to specs
of 114 deg intake centerline, 110 deg exhaust centerline (which equates to 112 deg lobe
separation and 2 deg retard), .410" lobe lift, and 245 deg duration at
.050" lift. During this process, the program asks what to use for
base circle. The smaller cam has a 1.250" base circle. You know
this larger cam will need less, so you specify 1.200" base circle as a
"first cut". Now you make an overlay graph of the actual cam
profile for the 2 files.
Screen showing Graph Specs for comparison graph
 click image to enlarge
Graph showing initial comparison between small cam with larger base circle
and bigger cam with smaller base circle. Note: All graphs for this
FAQ are shown drawn with thick lines so features show up better. Several
line thicknesses are available for graphing.
 click image to enlarge
Advancing the bigger cam profile 2 degrees on the graph shows a better
comparison
 click image to enlarge
Using the cursor you can find the exact amount of lift between the 2
profiles. You want all points of the new, larger cam to be below (less
than) the points of the smaller profile. This ensures there is enough
material to be ground off the cam to create the new, larger profile. The
"first cut" of using a 1.200" base circle is not small
enough. It appears that the bigger cam profile is at least .007"
higher than the smaller cam at some points.
 click image to enlarge
Go back into the Virtual Follower specs and reduce the base circle to reduce
lift by .008" lift (.016 inches diameter). This would be a new base
circle of 1.184 diameter base circle. Make the graph again, advance the
bigger lobe 2 degrees for better comparison, and check for any points of the
bigger profile being above the smaller profile. There are still some
points higher by .002", so try again with a 1.176" base circle.
This should keep the larger cam below the smaller cam by .002".
 click image to enlarge
Virtual Follower specs for creating the bigger cam profiles with 1.176"
base circle. Note that we are also assuming a 1.000" roller diameter
as was the case in the FAQ below.
 click image to enlarge
Graph again with 1.176 base circle and check that all bigger cam lifts are
less than the smaller cam lifts. By using the cursor at various points,
you verify that the bigger cam is below the smaller cam by about .002" at
the closest point.
 click image to enlarge
Set the Graph Setting of "Show End View of Cam" to Yes. This
is the same data as in the graph above, just graphed a different way.
NOTE: Before you can do this you must advance the bigger cam by 2 degrees,
as has been done in all other comparison graphs. When graphing with the
Graph Setting of "Show End View of Cam" to Yes, you can not advance on
the graph screen as the math to do this is very time consuming. So you
must advance it in the Test/Cam Setup screen as shown in the figure below.
 click image to enlarge
Graph with "Show End View of Cam" set to Yes. This also
confirms that the larger cam is below the smaller cam at all points. This
means there is enough material on the smaller cam for the larger cam profile to
be ground.
 click image to enlarge
To summarize: A 1.176 base circle should provide at least .002" of
material on the smaller profile camshaft (1.250" base circle) for this
particular larger cam profile to be ground.
Note: If the intake and exhaust profiles are the same for each cam,
then this process could have been easier by keeping the cam timing the same for
the bigger cam. In this case, the bigger cam had 2 deg of retard in the
timing, which required the extra step of advancing the cam 2 deg for all
comparisons.
Back to Top
Can I create an XY or polar angle/length file for roughing out a cam on my
CNC from .050" duration and max lift data only?
(Note: The profiles created by this simple method do not consider all
the required design features to be optimum in a race engine.)
Yes you can, but you need the Cam Grinder version. The process consists of the following:
Start a new Cam Profile with the "Type of Cam Data" set to "Create from .050" Cam Specs".
Enter specs you want. Say you want to create a profile for a solid flat
tappet cam with .380 lobe lift and 235 duration at .050" lift with a 110
lobe separation and .020" valve lash. You would enter them in the
screen as shown below, with this slight modification. Because the Cam
Analyzer requires at least .004" lash, you add .004 to the Max Lobe Lift
and Designed Vlv Lash, and enter a .004 Actual Valve Lash. This way you
get the full .020" ramp for taking up valve lash before the actual
profile. (If you don't understand this, just do as suggested above by
adding .004 to those specs and specifying .004 Actual Valve Lash.)
 click image to enlarge
This creates a file for these cam lobes, intake and exhaust.
Click on Settings at top of main screen, then Preferences. Click on
Electronics tab at top, and be sure to set "Show More Options in
Setup" to Yes to enable some needed options. Click on OK to keep this
change.
Click on Test/Cam Setup at top of main screen. In this screen, change the "Type of Cam Data" to "Measured with Electronics". (This "Type of Cam Data" format allows for much more advanced analysis than any other type.) The program will explain that this is a 2 step process. During this process, it will ask in you want to include a Base Circle Measurement. Say Yes and enter
your desired base circle for this cam, say, 1.25". This flags the software that you want to do Absolute Measurements, which includes the Base Circle value in lift. It also flags the software that you want to deal with all 400 data points which make up a "Measured with Electronics" file, 360 plus 40 additional to check repeatability, similar to the S96 file format.
Once created, click on "Back" at upper left corner to back out of this screen to main screen so this conversion is finalized.
Now, click on Test/Cam Setup at top of main screen again. Click on the Virtual Follower button and in the Virtual Follower screen. You should see your Base Circle entry in this screen. Set the Roller Diameter to the diameter roller you want to simulate, 1.00". Then also set the Probe Radius to exactly half of that, .50". This tells the program that the profile created is the exact profile I want this cam profile to produce. Click on Recalculate Results to make sure the program recalculates everything, which produces the Actual Profile data in addition to the follower profile data. Click on Back (OK + save) and you will see this conversion being done.
 click image to enlarge
Now click on Graphs, upper left of main screen. For the "Type" select "Pick from List" and you will activate the more advanced graphing types. Highlight just the "Actual Cam Profile" option from this list. Also set "Graph Absolute Lift" to Yes. In addition, if you want to get a file of XY coordinates, set "Show End View of Cam" to Yes, or No for Polar Coordinates. Then click Make Graph in lower left and a graph of your data will be produced.
 click image to enlarge
 click image to enlarge
To Export as a file, click on File (upper left), then Export and choose either XY or Polar as the 2 export options. It will ask for a file name for saving the data.
for an example of XY data.
for an example of polar coordinates data.
Back to Top
I have an OHC engine, with 2
cams, an Intake and an Exhaust. How do I set this up?
There are several Example Cam Designs preloaded for various OHC
engines. See Figure below.
 click image to enlarge
Even if you don't have one of these engines, the cam design may still match
engines by Dodge, GM, Nissan, etc.
If you don't think one of these choices will work for your cam, click on the
following link: Multi Lobe Instructions.pdf
Back to Top
I measured my diesel
cam with a .750" and .850" roller and show very little
difference. Is this correct?
First, let's see what the difference "SHOULD BE". This is
most easily done using the Virtual Follower feature in the Plus version of Cam
Analyzer. So you will measure the cam with the linear sensor directly on
the cam lobe. (The v4.0 lets you use a larger diameter follower like our
.750" Universal Roller, pn CTS-UR750.) Then you will fill in the
Virtual Follower specs screen with the information needed for the simulation of
what a .750" and .850" would do "riding on" this profile.
Surprisingly, the difference was less than 1 deg at .050" lift, but this
big diesel cam had a 1.65" base circle. Perhaps that is why the
difference is less than expected. The simulation was run again, this time
using a 1.10" base circle, which showed almost a 2 deg difference.
The table below summarizes the results:
| Base Circle |
.750" Roller Duration at .050" |
.850" Roller Duration at .050" |
Difference, Duration at .050" |
| 1.65" |
249.42 |
250.34 |
0.92 |
| 1.10 |
256.44 |
258.22 |
1.78 |
This graph shows the results:
The conclusions which can be drawn are:
- The difference in duration produce by a .750" and .850" roller
may not be as large as you imagine.
- The difference in duration produce by a .750" and .850" roller increases
as the cam's base circle decreases.
Back to Top
I measured the cam with the pointer
directly on the lobe and the results don't look anything like the Cam Catalog's
Specs. Why?
Measuring a cam profile with a pointer (not the actual follower) directly on the cam lobe DOES NOT give the true follower lift as
it would in the engine. You have to either measured the cam profile with the actual follower, OR use the Virtual Follower feature, part of the Plus version of Cam Analyzer.
Click here to see what the Plus version
adds, paying close attention to the Virtual Follower feature.
Check the graph below of typical test results "as measured" (pink line is lift, yellow line is accel) and after
simulating a roller follower using Virtual Follower (blue line is lift, green is accel). You can see they are totally different, which explains why your measurements do not match the catalog's Cam Specs. You can see the Virtual results, simulating a follower will give more lift at TDC, larger duration
numbers, much lower acceleration over the nose of the cam.
My Results do not repeat when I measure
the same lobe again. What could be happening?
Repeatability should easily be within .0005 for lift and within .25 deg for
duration and events. If not, check some of these testing tips:
- For roller lifters, the roller bearings could change slightly as the
roller rolls. If you have a roller lifter to waste, force some shim
stock between the roller and the lifter to prevent rolling. Also, how
the lifter roller axis aligns with the cam axis (they should be exactly
parallel) will affect test-to-test repeatability. We have the Universal
Roller with a ball which eliminates the 2 potential problems above.
- Rotate the cam relatively slowly and smoothly. The software is
designed to be very forgiving for erratic movement. Stopping and
starting should not be a problem. However, going too fast over the
lobe will produce errors. Going faster on the base circle is typically
not a problem. The "warnings" the program gives about
rotating the cam too fast are overly cautious. Most users turn off
these warnings in the Preferences section.
- Be sure the linear encoder's arm holding the lifter is always
perpendicular (90 degrees) to the cam axis. This means it is as close
to the cam as possible, and the lifter is always directly over the
centerline of the cam. This is especially critical for roller lifters
and when using the linear encoder's pointer directly on the cam lobe for the
Virtual Follower feature.
- Be sure to tighten up the linear encoder stand when you move to the next
lobe.
- Be sure the linear encoder does not top out or bottom out as it goes
through the total range of motion.
- Be sure the lifter moves smoothly in the bore so its weight can keep it in
contact with the lobe at all times.
- The cam should turn easily and smoothly in the "V" blocks.
You may have to clean any coatings off the cam lobes for this to occur.
- Be sure the cam lobe is free from dirt, coatings and debris. New
cams often come with a "break in" coating. This should be
cleaned off before you can get accurate measurements. If
all you need are approximate measurements, you may choose to
leave this coating on the lobe.
- Be sure the linear encoder's point is setting on a flat spot on top of the
lifter. We have magnets which you can place on top of lifters to
provide a flat top. If the pointer is on the edge of the pushrod's oil
hole, it may move to different depths as you measure the lobe.
- The rotary encoder can not slip during testing, as then you lose your
degrees index. Things to check for slippage include:
- When you are done testing a cam, back out
to the main screen and note the centerline of the 2nd lobe you
measured. Typically this would be the Exhaust lobe on Cylinder
#1. Click on File, then Save to save your results. Then go
back into the Record screen without powering down the
Black Box II. If the box is not powered down and you don't re-zero
it, it will retain its rotary index. Re-measure this 2nd lobe and
see if the centerline comes up within .25 degrees of the first
measurement. If it is way off (2 deg or more), you've had slippage
or the rotary encoder has lost its index for some reason.
- Another thing that could look like slippage. It is critical that
the body of the rotary encoder be held stationary. This is
done by making sure the rotary encoder's arm is held firmly to the
magnet. If the magnet the rotary encoder's arm is attached to has
a rough edge, and the cam is moved front to back, the arm may be in a
slight notch for one lobe, and on a slight peak for the next lobe.
This is not good. Also, if the encoder's cable is not helping to
hold the encoder arm to the magnet, the encoder's body may be moving
around.
- Some cams do not have a large face for the rotary encoder magnet to
attach to. We use a split collar to lightly clamp on the end of
these cams to provide a larger face.
- Be sure the rotary encoder is centered on the end of the cam.
Slide and hold the magnet back from the encoder's index point.
Place the point in the end of the cam, then slowly release the
magnet. This ensures the index point is well seated into the
centering hole in the end of the cam.
Click
here for the PDF we send with the Cam Test Stand with these and possibly
more Accuracy Tips
Back to Top
I'm using the Virtual Follower
feature, but my results do not look like what the cam should be?
Here's some things to check for when using the Virtual Follower feature:
Be sure your measurements are accurate. When you put the very
small radius pointer from the linear encoder directly on the lobe, errors which
are minor when using the actual follower on the lobe now are very critical.
- Be sure the linear encoder pointer is directly on top of the lobe.
This means that when the pointer is on base circle, it is on the highest
part of the lobe. See Figure Below.
-
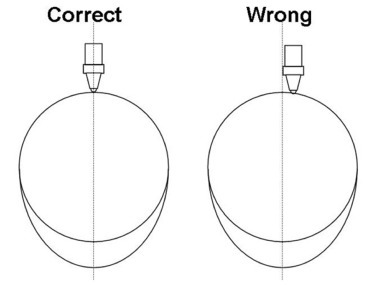
- Be sure that all parts of the Cam Stand are tight and can not move during
the measurement. This includes the V blocks, the tip of the linear
encoder, the linear encoder bracket (especially the thumb screw for the
slide of this bracket), etc.
- Be sure the linear encoder is not binding or catching from side loading on
steep ramps. This is especially common on new cams where the lobe is
still rough.
Be sure your calculations are accurate. This means you have
accurately filled in all the Virtual Follower specs correctly.
- Cam Lobe Base Circle Diameter has a much larger effect on this than most
people would think, and can easily change from cam to cam for the same
engine design. Do NOT just assume our default is correct for your
cam.
- Obviously, Roller Diameter is critical for roller cams.
- For the OHC Rocker Arm designs, most all measurements are critical.
Also, be sure you have correctly identified the rotation direction of the
cam. Once you have measured a couple of lobes, use the "Watch
Cam/Follower" feature to watch the valve train move to verify this is
correct. Also notice on the left side of this screen that the view is
correct, either from the Front or Rear of the engine.
Back to Top
What is the advantage of using
the Universal Flat Tappet (or TDC Checking Bridge) to find TDC?
Without bridge, you must tell program where #1 Intake Lobe is timed (like 108
centerline, .045" lift at TDC, etc). Then the rotary encoder is timed from this for all other
lobes on the cam.
With the TDC checking bridge, you find dowel pin or keyway location. Then with info Performance Trends has on where these are suppose to be located (timed) for about 100 common engines, we can say how the cam was designed to be timed in the engine. This assumes you will use standard timing gears, timing marks, etc.
However, if Performance Trends does NOT have information on your particular
engine, and you can not obtain it, you will have to measure a few cams to obtain
your own number.
Back to Top
Will the software let
you extrapolate from a .750 inch diameter roller lifter to a .800 inch diameter
roller?
V3.8 and earlier required you to measure the cam with encoder's pointer to do
Virtual Follower simulation, not a follower. With v4.0, the program
now lets you specify the diameter of the "pointer" you are using,
which could be the standard tiny Ono Sokki pointer on the tip of the
linear encoder, or our Performance Trends .750" diameter Universal Roller,
or some other diameter. This other diameter could be for a roller follower
you used. However, it is not recommended you go very much larger than
.750" diameter.
Back to Top
Do I need a different follower
for every type of cam I measure?
If you are measuring a flat tappet cam, then you can use the flat tappet of
the same size or larger for all flat tappet cams. Note: There can be
very slight difference due to the differences in "crown radius"
between different flat tappet cams, but this typically would produce less than
0.1 deg error. Also, if a cam is designed wrong and runs on the edge of
the flat tappet (tappet is too small for the cam) you can also get small errors.
If you are measuring a roller tappet cam, then you can use any roller with the
same roller diameter for that cam.
You can also use the "Virtual Follower" simulation in the Plus version
of the program to simulate most any flat or roller follower and several OHC
rocker arm geometries. Then you don't need any followers to ride on
the cam lobe when you measure it. However, the
"simulation" may be slightly different than using the actual follower
because the setup is more critical to have exactly correct. See FAQ above by clicking
here.
Back to Top
Do I need to zero out the linear
encoder (lift measuring device) before I measure a lobe?
Rezeroing the lift indicator (linear encoder) before measuring has NO affect on the results. After the full profile is recorded, the program
figures out what should be called zero lift, based on either of 2 criteria which can be set in Preferences:
1) The program takes the AVERAGE lift it finds on base circle and calls this zero lift. This can be a little difficult because it can be difficult to determine where base circle ends and a fairly gentle ramp begins. However, this is the number used by several cam grinders. For this
situation, you will see both + and - lift values on base circle.
2) The program takes the MINIMUM lift it finds on base circle and calls this zero lift. This is much easier to determine, and you will see only + lift values for the whole profile.
Back to Top
I've got a cam with multiple lobes
for each cylinder. How can I export a Cam Dr file to the Engine Analyzer
Pro?
I recommend you do NOT export the file as a Cam Dr file. The Cam Dr
format consists of 1 Intake and 1 Exhaust lobe, and was developed many years ago
for cams with 1 intake lobe AND 1 exhaust lobe for all cylinders. Many
cams with multiple lobes for each cylinder are all intake or all exhaust lobes,
and do not have both intake and exhaust lobes. Also, you may want to
export the "B" lobe for the intake with the "A" lobe for
exhaust lobe. The combinations makes a Cam Dr format very difficult to
deal with.
Instead, export as a "S96" format, which is just for 1 lobe.
This file can be used in the Engine Analyzer Pro for either the Intake or
Exhaust lobe. This is done by clicking on "File" (upper left
corner of main screen), then "Export as Cam Dr (and other formats)"
for the screen below. The "Browse" button should quickly find
the "CamFiles" folder in your Engine Analyzer Pro, the default
location the Engine Analyzer Pro uses for cam files. Choose the S96 format
as the "Format" and enter the other info required, including picking
the "Lobe to Use" from the drop down.
Back to Top
If I want to check a cam in the engine (or an
OHC cam in the head), what do I do different?
There are 2 options in the Record Screen which change how the sensors read
lift and rotation. If you start a new test using the EZ Start Wizard, the
Wizard will prompt you for these 2 options if you say 'On Engine' at the 'Cam
Test Stand' screen. See below.
 (click image to enlarge)
Even if you don't use the EZ Start Wizard, you can make these changes under
Options in the Recording screen. See below:

 (click images to enlarge)
The 'Reversed' setting for the Linear Sensor means the sensor records
extension (as the valve goes down) as lift.
The 'On Crankshaft' lets the program know to expect 2 complete revolutions to
be equal to 1 camshaft revolution.
These options should allow you to make most any cam measurements, either on
the stand or in the engine or head.
Back to Top
Filtering seems to have a large effect on the
acceleration readings. What is the correct Filtering setting to use?
When you have a very high "spike" in data (like the accelerations of this cam) over a VERY short period of time, the filtering level has a large effect the height of the spike. Going from
None to Some to Medium to Heavy filtering reduces the magnitude of the acceleration
spike significantly each step. On the closing ramp, it drops from .035 to
.012, or to much less than half of the unfiltered value. However, over the nose of the cam (the negative acceleration), there is almost no
effect from Some to Medium to Heavy, where it remains constant at -.006 to
-.005. That's because the acceleration over the nose
occurs over a long period of time, and is not changing quickly.

Therefore, there is a certain amount of user judgment which must be used for the
proper Filtering setting. With filtering = None, the acceleration looks way
too jagged to be useful. At Filtering = Some, it looks fairly well behaved.
Filtering beyond this amount is NOT improving the data quality. Judgment at this point would say Some filtering would be correct.
Here's some guidelines for the proper filtering.
- The basic principle for filtering is use the smallest amount which smoothes the data just enough for your use.
- If the values you are looking at go up at one point, then down, then up
again, then down again, you probably need more filtering.
- For acceleration measurements, you most all the time need at least
Light filtering. When the program produces a number for reporting
PkOpen, PkNose, and PkClose acceleration numbers, it is using Medium
filtering.
- At Light filtering for acceleration, if you measure a cam lobe again, and
a "spike" or "drop" occurs at the same exact point each
time you measure a lobe, then the effect could be real. Do not
increase the Filtering to Medium or Heavy to smooth out this real
affect. It may not necessarily be something wrong with the cam
lobe. There could be a problem with your measurement setup, like dirt
on the lobe, or a loose tip on the linear encoder, or a lifter which is
getting cocked in the lifter bore from side loading. With
filtering, you want to improve the data quality, but NOT cover up real
effects.
for a FAQ on recommendations for Jerk filtering
Back to Top
I'm a cam grinder, and I want to see all
lobes spread out like when viewed from the end of the cam. Is that
possible?
Yes, but you need the more advanced Cam Grinder version of the
software. Most cam grinders will also want to locate the lobes with
respect to the "timing point", be it a dowel pin or keyway.
 click image to enlarge
 click image to enlarge
for a 4 page description of how this is done.
Back to Top
When I graph the Jerk for a
profile, it just seems to be a bunch of jumpy lines. Why?
Valve or Tappet Jerk is a calculation which really looks at a cam profile in
great detail. It is technically called the third derivative of Lift, or
the derivative of acceleration. If you are driving on a new highway, it
feels quite smooth. However, if you get out a magnifying glass, you would
see little stones and holes all over. Jerk is like looking at the cam
profile with a strong magnifying glass. The graph below shows the
definition of jerk (red line), as the rate of change in acceleration (light blue
line).
 click image to enlarge
Here's what jerk looks like with no smoothing or filtering to the data for 5
different measurements on the same lobe, manually turning the cam on a
non-motorized Cam Test Stand with V Blocks. Some measurements were
purposely done fast (in about 10 seconds) and some were done slow (taking over
20 seconds) to see if it affected the data. Testing showed almost no
advantage to taking a great deal of time doing the measurements.
 click image to enlarge
Here's the Graph Type screen which lets you apply some smoothing to the
data. For Jerk, you often want to apply as much filtering as the program
allows. We applied filtering both to the tappet lift measurements, and
then also applied Heavy filtering to the Jerk calculations.
 click image to enlarge
When you apply these heaviest filtering levels, you can see that the Jerk
graphs all compare very well with each other. So, in conclusion, for
evaluating Jerk calculations it is best to apply the heaviest filtering levels.
 click image to enlarge
for a FAQ on recommendations for Acceleration filtering
Back to Top
Can I find TDC with the
linear encoder on the top of the piston?
Yes, it can be done if you set the "TDC Method" in Test/Cam Setup screen to "User Finds TDC with Sensor". This is typically meant to find a dowel pin or keyway location, but will work equally well with the piston going up and down. Put sensor on piston top about 0.2" from TDC, rotate crank through TDC and back down to about 0.2" after TDC (program will tell you when it is enough), and then tell program this was 0 deg from TDC. This should be the TDC during overlap, not during compression..
Back to Top
How can I tell if a cam is
hydraulic or solid, and if solid, what lash it is designed for?
It is not always obvious if a cam profile is hydraulic or solid, but
generally a solid has a different type of ramp up to the point to where all the
mechanical lash is taken up. There is typically a "constant
velocity" ramp, which means the acceleration rate is zero. After this
ramp, the acceleration jumps way up to get the valve moving off the seat.
If the solid cam graph below, you will see a small acceleration bump at the
beginning of the opening ramp, then the constant velocity portion with zero
velocity, then the strong opening acceleration portion of the opening
profile. The hydraulic cam shows more of one big acceleration ramp on the
opening. (Some modern solid lifter profiles do not follow this pattern,
and therefore the software can NOT determine the lash point for the cam.)
 click image to show lift and acceleration graph for solid cam
 click image to show lift and acceleration graph for hydraulic cam for comparison
The Plus version of the Cam Analyzer has some routines built in it to
automatically find the lash point for both the opening and closing
profile. We do both so that if you see good agreement, within a few
.001", you know that the lash point found looks reliable. If there is
more than .005" difference, the lash point may not be that accurate.
To do this, you first select the "Seating Velocity" report type shown
below:
 click image to show Report Specs
Click on the More Report Settings to obtain more inputs to define the Seating
Velocity report. Be sure to turn on "Estimate Lash on Cam Profile".
 click image to show More Report Settings
Click OK on More Report Settings, and Make Report button on Report Specs to
create a report like the one below. Here you see this particular profile
is estimated to have a .0123 lash point on the opening ramp and .0129 lash point
on the closing ramp. Since they agree quite closely, it can be assumed
this profile was designed for about .012" lash.
Back to Top
Why does the Radius of
Curvature jump around so much?
On base circle, the radius of curvature (ROC) is the base circle radius. Over the nose of the cam is should be less than base circle ROC.
If there is some dwell over the nose of the cam, the minimum positive radius of
curvature may be before or after the exact nose of the cam. On ramps where
the radius of curvature goes negative, it should start at base circle ROC, then to get to
a negative ROC it must go through a portion of the ramp where it is almost flat. Well, flat means
a very large ROC. So it should jump up to a high positive ROC like +30, then drop to a very low ROC (flat with slight negative ROC) like -30, then
come back to the minimum negative ROC as shown in the graph.
In other words, to go from positive to negative, it has to make big jumps.
 (click image to enlarge it)
Back to Top
I'm
measuring in millimeters. Why do my lobes look so "rough", like
stair steps?
If you are measuring in millimeters, are you using a computer where the
operating system uses a comma "," for the decimal point? An
example would be the number in the United States would appear as 55,332.11, but
as 55.332,11 in say Germany. This is very common outside the USA and will
cause problems as shown in the pictures below:
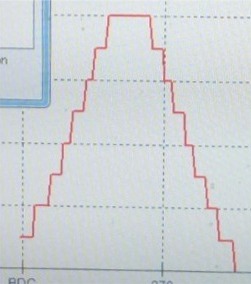
 (click image to enlarge it)
To fix the problem, go into Control Panel in your computer and find Regional
Settings or Regional and Language Options. Here you can just select
"English (United States)" or use the "Customize" option to
make the changes needed. Selecting "English (United States)" is
usually the most reliable.
Back to Top
How do I check if the
rotary and linear sensors are good?
Encoders are NOT likely to go out of calibration. They are completely digital.
Linear Sensor: Remove the cam from the stand. Lower linear sensor so it is very close to the stand. Lay a piece of steel (ideally a 1-2-3 rectangular block) on the stand and lift sensor and slide under sensor and read result. Then do again with a different side up on the block and read result. The difference in the result should be difference between 2
thicknesses of the steel block. If the result is close to what it should be, I would strongly trust the linear encoder's measurements more than what you can measure on the rectangular block.
Rotary Sensor: Put cam on the stand and attach rotary sensor. Put linear sensor directly on base circle of cam. Mark base circle with a "shapie" pen where pointer is touching the cam. Note the linear and rotary sensor readings. Rotate cam exactly 1 rev based on sharpie mark. Are both encoders back to their original readings? Did rotary sensor just show 1 revolution? Now rotate cam 9 more revs. Did it return to the same reading? Now try 10 revs in the reverse direction.
Again, if the linear sensor (.002 inches) is off slightly, my guess it is due to some 'sticktion' in the system or lateral movement on the cam on the stand.
If the rotary sensor is off slightly (5 deg in 10 revs), my guess it is due to some slippage of the magnet on the end of the cam.
More than that could be a problem.
Back to Top
Can I import a lobe from 1
file into another file? or Can I combine 2 files together?
Yes you can, but the process requires a few steps. The picture below
shows the option to "Add this lobe to the existing file".
for a detailed explanation.
Back to Top
I'm
getting a "bump" in my profile when trying to do virtual follower on a
cam file I've imported from a different software. Can I fix it?
Minor measurement errors can get greatly magnified with the Virtual Follower
simulation, depending on where they occur on the lobe and the severity.
Cam Analyzer v4.3 A.004 and later will watch for these types of problems and
give you warnings and options. The picture below
shows what a "bump" could look like.
for a detailed explanation of your options.
Back to Top
I'm measuring my OHC
rocker arm cam with Intake and Exhaust lobes on the stand (not in the
engine). How do I set this up in the software?
My cam is for an OHC with center pivot rocker arms with the intakes on one
side and the exhausts on the other. How do I describe this layout to the
Cam Analyzer software so I can measure it on the Cam Test Stand and have the
lobe separation done correctly.
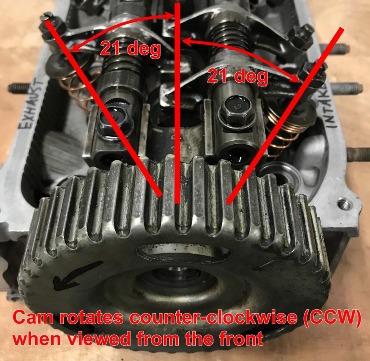
for a detailed explanation.
Back to Top
Engine Log Book Questions
What
measurement gauges will load info directly into the Engine Log Book?
We are often asked about what measurement tools will communicate with the
Engine Log Book, for automatic data entry. The only tool we have made
special provisions for is reading the TraceBoss
(tm) software files for recording surface finish. Click the TraceBoss
(tm) link to see the many gauges it works with.
For Measuring Bores:
QMP Racing Engines uses a Sunnen GR-2121E for the Cylinder Bores
(2.0 to 6.0 inches) and a Mitutoyo 511-751
with a 543-312B Indicator (0.70 to 1.40 inches) for the Lifter Bores and other
smaller bores. You would need a cable # 06AFM380F that will work for both
gauges.
For Measuring Lengths, Widths, etc:
for youtube movies on other gauges inputting data directly to the Log Book.
One customer reported that his iGaging bluetooth tools communicated well with
the Engine Log Book.
My Mitutoyo bore gauge will not
communicate with the Engine Build Log Book. Why?
A customer was using a Mitutoyo "Absolute" bore gauge with Mitutoyo
U-Wave-Pak blue tooth. It did not seem to communicate with the Engine
Build Log Book. If he used Windows blue tooth, it did communicate.
Mitutoyo recommends also using the Mitutoyo U-Wave-R to fix this issue.
Performance Trends can not verify this will always fix this issue.
Back to Top
Valve Spring Tester Questions
After testing my valve springs, can the software tell me the required install height to produce a certain seated force?
The Valve Spring Tester software has setting called "Find Ht at This
Force". See the Test Setup Specs screen below. Note that this
force can be different for the intake and the exhaust springs.
 (click image to enlarge it)
After you test your springs, you can do a Report as shown below. The
header section shows the "Ht for:" and lists the force for both the
Intake and Exhaust. Then the Installed Height to produce this force is
shown in the rightmost "Ht for Force" column. Also included in
the report is the current "Seated Force" for the "Seated
Height" you set in the Test Setup Specs screen.
So, for the first spring "Int 1", the actual Seated Force measured
was 41.7 lbs at the specified Seated Height of 1.640 inches. The "Ht
for Force" column shows that you would have to set an Installed Height of
1.649 inches to produce a Seated Force of 40 lbs.
 (click image to enlarge it)
Back to Top
Drag Racing Software Questions
How can your Drag Racing Analyzer accurately predict Dial
Ins and Throttle Stops if it doesn't let me enter several past ETs and weather
conditions about my car.
Good question. It is correct that you can build up a data
base of how your car performs in different weather conditions. Then the
data base program will predict how your particular car will
respond to different weather conditions. However, this is much easier to
do on paper than it is in reality for these 4 critical reasons:
-
When you first get the program, you have no data
base. It will take many passes to build up enough different conditions
so the program can predict things accurately.
-
You must encounter many very different
weather conditions for your data base. For example, to accurately
predict the effect of headwind or tailwind, you must have passes in the data
base of all ranges of wind conditions. Ideally, these different wind
conditions would be at all different levels of barometer, temperature and
humidity.
-
The data you enter must be extremely
accurate. You have all made back-to-back runs where your ET changes, perhaps
increased .100 seconds. Lets say the weather was exactly
the same except the air temp fell 1 degree. A data base
program would then assume 1 degree drop in temperature (better air) produces
.100 seconds increase in ET (slower), or 30 degree drop produces 3.0 second
slower ET. We all know this is totally wrong. (Also, you must
never make mistakes just entering all the data., For example, entering 29.50
when you should have entered 29.05 could completely distort the
predictions.)
-
The data you enter must only change for the
reason you say it changed. If you make a change to your car (shock
settings, tire pressure, engine modifications, etc), then the data base is
"screwed up". The data base only sees weather conditions as
producing effects in ET. Like in the example above, if you change tire
pressure which slows you down .100 seconds, and the air temp dropped 1
degree, a data base program would again see a 1 degree drop producing .100
second increase in ET. Again, this is totally wrong.
To summarize, a data basing program can work if the data you
input is perfectly accurate, your car is extremely
consistent, and you never modify your car or driving
style.
The Drag Racing Analyzer is much easier and foolproof. It uses the same
sophisticated techniques used by automotive engineers (GM, Ford, etc) to predict
the effects of weather conditions. These techniques are based on the
physics and aerodynamics of a broad range of cars, fine tuned over decades of
experience.
When you first get the Drag Racing Analyzer, you enter your car's specs into
the program and save them. You can check these inputs by seeing if the
program can predict your ETs, RPM range, 60 foot times, etc. This fine
tunes the program's predictions for your car. For example, a
pickup truck will be affected by wind conditions differently than a Corvette,
and the Drag Racing Analyzer knows how differently.
To predict a Dial In, you make your first pass (time trial or practice run) and tell the
program how you ran and the weather conditions. This could be with a
different cam, tire pressure, converter, etc. than last week. (Many of
these modifications you can enter into the program so it will be close after you
make these modifications.) Entering the exact ET and weather for a pass
for how your car is performing right now makes the upcoming predictions
extremely precise.
Now the program is ready to predict your ET for the next pass. Just
enter the weather conditions for the next pass and the program predicts the ET
based only on the change in weather. As long as you don't modify the
vehicle between passes, the prediction will be as precise as is mathematically possible.
(Throttle Stop prediction is a little more involved and requires 2 practice
runs.)
In addition to Dial In and Throttle Stop prediction, the Drag Racing Analyzer
lets you try all sorts of "what if's" with vehicle, engine,
transmission, converter/clutch, weather and driving style modifications.
It is a complete drag racing analysis package. Say, that's a
good name for it: Drag Racing Analyzer!
Back to Top
Do I always have to make 2 runs to
"calibrate" my Drag Racing Analyzer for predicting Throttle Stops?
If you read Example 4.4 in the Drag Racing
Analyzer v3.0's user's manual on page 138, it explains how to let the Drag
Racing Analyzer know how your particular throttle stop, engine, vehicle, etc
responds to a certain change in throttle stop setting.
A new feature added in v3.2 is the ability to predict throttle stops based
the "Adjustment Factor" obtained from these 2 runs. This means
you do only have to run the 2 "calibration runs" once for your
car. Once you obtain the "Adjustment Factor", you simply supply
it for the next series of runs at various tracks and events. Click
here for the Drag Racing Analyzer v3.2's Supplement of changes which
describes how this is done. Also check pictures below.
If you have the time, it is a good idea to check this "Adjustment
Factor" if you have made a big change to something, different gearing,
engine, major altitude change, etc. This feature just gives you an
additional option.
Throttle Stop Screen from 2 "calibration runs" to obtain the
"Adj. Factor
Throttle Stop Screen using this "Adj. Factor" for predicting a
Throttle Stop Setting in "new air"
Back to Top
How do I import Drag
Race DataMite data into my Drag Race Pro 'Team Engineer' simulation program?
To send data to Drag Race Pro from Drag Race DataMite:
- In Drag Race DataMite, make a time Report of chosen channels you want to
export in some short time interval, like .1 second.
- Click on File at top to open up the ASCII file options.
- Choose just "Include Text" and "Comma Separated" options at the top, nothing else.
- Enter or browse to create file name, then hit Save File.
- In Drag Race Pro, select File, then Import Data Logger File.
- Browse to the DataMite ASCII file you created and select Open.
- In the lower left corner, click on a data type from the File Data Column
of available ASCII data channels from the DataMite. Then click the associated
Drag Race Pro data type which would match it from the Graph Data Name section.
- You will now see these data types and Data Names paired up in the Data Column Assignments at the top.
- Set the other inputs on the left side, then click on OK (import file) at the upper left corner.
- Now this file will appear in the History Log for you to graph with other data. Calculate ET, then click on
Graph at the top of the performance results.
- In the Graph Screen, click on History Log at the top, then find this imported data logger file name and put a Yes in the "Graph?" column to choose
it for inclusion on the graph. Then click on "Graph Tests marked Yes" at the upper left of the History Log.
You should see this DataMite data included on the graph.
Back to Top
How do I measure the
car's Center of Gravity Height, or CG Height?
The vehicle's Center of Gravity (or CG) is the point at which you can assume
all the vehicle's mass is located to do calculations. The height of the CG
primarily affects weight transfer under accelerating conditions, and therefore
is critical for predicting vehicle performance. For Drag Racing, typically
a high CG is good to transfer weight to the rear (on the driving tires) during
launch, unless you have a front drive car. For Road Racing, typically a
low CG is good to minimize the transfer weight to the outside tires (and off the
inside tires) during a turn, which keeps all tires more evenly loaded for good
traction.
However, even though the height of the CG is critical for performance, it is
not necessarily critical to enter your vehicle's exact CG height to do a good
analysis. That is because for the programs, you are looking at trends.
Say you enter the CG height as 20" in our 4 Link Calculator, and frame
mount A produces 88% anti-squat and frame mount B produces 101%
anti-squat. If you change the CG height to 19", then frame mount A
produces 92% anti-squat and frame mount B produces 105% anti-squat. The
anti-squat numbers change, but B still has about 13% more anti-squat for either
CG height. The trend is the same.
For that reason, and because most of the vehicle's weight is concentrated in
the engine and transmission, a rule of thumb has evolved over the years that the
CG height can be estimated as the camshaft height in a V-8 powered car. We
at Performance Trends say 5" above crankshaft height to cover all engine
types and camshaft layouts.
Most all the programs which have CG Height as an input also include a "Clc"
screen to let you calculate it from a test. The test is simple "on
paper". You simply record the change in vehicle weight on one of the
car when you raise the other end of the car a certain distance, as shown below
from page 52 of the Suspension Analyzer user manual.
However, here are some critical points when running this test:
- The springs can not compress or extend. Ideally you should replace
all springs with solid struts adjusted to ride height lengths.
- Ideally, the brakes should not be on. Chock the tires so the
vehicle can not roll off the scales.
- You must place the raised tires on blocks to take the scale
readings. For example, you can not just raise the back of the car at
the rear bumper to obtain the change in weight of the front tires.
- It is probably a good idea to have scales at all 4 corners at ride height
and raised, so you can confirm the total weight of the car does not change
when you have the one end raised.
- The more you raise the one end of the car, the more accurate the
test. However, you must be very careful doing this test as the tires
can easily roll off the scales.
- You should "jostle" the car to eliminate any "sticktion"
in the scale readings before taking them. A reading error of just a
few pounds can create totally different results as indicated below.
Here's the effect of just a 5 pound difference (from 1356 to 1351 lbs, or
0.4%) in the weight change, producing a 1.3" CG height difference (from
21.5 to 20.2 inches).

I think you can see that for all the hassle and potential safety issues, a
reasonable estimation of 5" above crankshaft height is much easier, faster
and safer.
Back to Top
Why can't I just type in my
converter's stall RPM and have the program always use it for "stall
RPM"?
You have all seen the ads for "4500 RPM stall converters".
They certainly make you think a converter has a certain stall RPM built
in. Well they don't.
First an explanation of stall RPM: Stall RPM is the RPM of the engine
(input RPM to the converter) when the output of the converter is stalled (not
turning). Think of any automatic transmission car with the wheels locked
by pressing the brakes. At idle in gear, the "stall RPM" may be
700 RPM for a production car, where the engine is producing nearly 0
torque. If you step on the gas some, the engine RPM and therefore stall
RPM goes up to, say, 1000 RPM. Step on the gas some more, and the stall
RPM goes up to, 1500 RPM. This is all with the same converter, but
different amounts of engine torque going into the converter.
This
trend does not stop, but continues as you put more and more torque into the
converter. Stall RPM increases as shown by the graph below.
So what is the
difference between different converters, because they do change the "stall
RPM" if you install a "4500 RPM stall converter" compared to a
stock converter. Well, what is changing between converters is something
called "converter capacity". The higher the capacity, the higher
the stall RPM for a given amount of engine torque. The graph below shows
how stall RPM changes for 3 very different converter capacities of 100, 200 and
300, as engine torque changes from 10 to 1000 ft lbs.
Stall RPM vs Engine
Torque for different Converter Capacity factors
To be accurate and
realistic, the Drag Racing Analyzer programs will ask for a converter's capacity
factor. The Drag Racing Analyzer programs all have methods of entering a
stall RPM for the particular engine's torque curve, and then the program will
estimate the Capacity Factor. This makes it easy for you to estimate
Converter Capacity. But if engine torque changes (because of engine
modifications, weather, etc) the stall RPM will also realistically change just
like a real converter.
for a more in depth explanation in our Motorsports Blog.
Back to Top
How do I adjust my ladder
bars in 4 Link Calculator to prevent wheel stands?
Ladder bars have significantly less adjustability than a full 4
Link. This particular customer had mapped out his ladder bar's
anti-squat settings and they varied from 138% to 188%, all quite high.
With a ladder bar, the instant center is at the attach point of the bar on the
frame. So the instant center length has little adjustability, but it is
quite far back, not toward the front of the car which can increase the tendency
of wheel stands.
So, as far as ladder bar setup goes, nothing stands out as a problem.
So I pulled in a favor from our "hands on" drag race specialist
Burgess Coleman and he had the following thoughts:
- It sounds like his car hooks up good. What I would do is work to control the lifting rate. Here's some of the things I would do to help control the rate. I use that sensor that I got from you to help me significantly with controlling the lift rate.
- Front shocks-Tighten the extension knob so to slow down the lift rate. Go to the point where it starts to affect traction.
- Timing kill-I use that a lot to limit that initial surge of power and it won't hit the converter so hard. I activate mine for 0.8 seconds and up to 14 degree retard. This is really briefly and affects performance only slightly.
- Weights-Place a ten pound or so weight at the front most part of the car. That small weight will generate 100 or more pound of torque to resist lift. Ten pounds won' t really affect performance much. Couple thousands.
- This would be my first steps. After that I would put a switch on the front suspension and go into Two Step mode or some other power reduction mode. (At a certain height)
Again, many thanks to Burgess for great ideas. You'll see his expertise
in other FAQs on this page.
Back to Top
My 4
Link Calculator does not draw my ladder bars correctly. Does that
matter?
Ladder bars are assumed to be welded (or attached) solid to the axle.
Because of that, the bar's shape has no affect on its
function. For example, in the picture below, it shows the 4
Link Calculator's standard drawing of a ladder bar at a particular hole on
the frame, the 2 blue bars which meet at a single point. Bars shaped like
the red bar or green "J" bar are exactly the same as far as suspension
performance is concerned. All that matters is where the bar attaches to the
frame.
Back to Top
Suspension Software Questions
I don't know which
suspension program to get. Can you help? How about Dirt vs Asphalt?
We have 2 "families" of suspension analysis programs, Circle Track Analyzer and
the 3D Suspension Analyzers.
for a side-by-side comparison of features in these programs.
Our Roll Center and Roll Center Plus are all based on the
Circle Track Analyzer with portions of the
Circle Track Analyzer turned off.
Circle Track Analyzer with all features removed but the Front Suspension screen is the Roll Center Calculator. Circle Track Analyzer with all features removed but the Front Suspension and Rear Suspension screens is the Roll Center Calculator Plus, which also does simple handling analysis (how tight or loose a particular setup is). These 3 programs do the analysis with just simple 2D inputs, which treat the front suspension as if it was drawn on a flat sheet of paper. Because of that, these programs will NOT do bump steer,
Ackerman, caster, toe in changes and roll steer and anti-squat in the rear, and
many other calculations.
But, the full Circle Track Analyzer can actually "drive" the car around an
asphalt track you specify and estimate lap times and how lap times are likely to
change with vehicle modifications. It is our only suspension program which
does this type of lap time simulation and analysis.
Our other family of programs is the much more detailed 3D Suspension
Analyzer. It comes in 3 versions, Standard (front end only), Full
Vehicle (front and rear suspensions), and Full Vehicle with Data Logger features
(with extra features including ability to read and "play back" data
logger data). Because is it 3D, it requires 3 measurements (out from
centerline, up from the ground like the 2D programs, but also "depth"
into the car) for each suspension point and uses many more points than the simpler 2D Circle Track Analyzer. The Suspension Analyzers WILL do bump steer,
Ackerman, caster, toe in changes and roll steer and anti-squat in the rear. However, it also requires you to make more measurements to use it.
If you know what you are looking for, like "I want my Camber Gain to be 2 deg per inch of dive", or "I want more rear roll steer", you need
a version of the Suspension Analyzer program. If you are an ASPHALT circle track racer, not sure of what a program can do for you, and want a program to make suggestions of things to try, we recommend the Circle Track Analyzer. If you are an DIRT circle track racer and fairly new to computers, we recommend the Circle Track Analyzer or maybe Roll Center Plus.
Unless you know exactly what you are looking for, we typically do not recommend a program which just deals with the front suspension only. That is because a program can not analyze a setup (give a "handling rating") without knowing something about both ends of the car.
For Dirt vs Asphalt
Again, we have 2 "families" of suspension programs, Circle Track Analyzer and 3D Suspension Analyzer.
The Circle Track Analyzer actually tries to predict lap times, dynamic corner weights, dive and roll, and much more. For it, all assumptions for lap times, cornering traction, etc are based on asphalt. We have many users using the program for dirt, and reduce the "Traction Factor" in the Vehicle specs to numbers like 80% or so and can simulate their dirt times quite well.
Circle Track Analyzer makes for doing it's lap time simulation and handling
analysis based on these 2 assumptions:
- The car is fastest if you do NOT break the tires loose.
- The car is fastest if you most evenly load all 4 corners of
the car, to not overload any particular tire.
If you agree with these 2 assumptions, then the Circle Track Analyzer can do a
good analysis of your dirt car. But we have all seen winning dirt racers
with 1 tire off the ground, sliding the rear end out, using the tire's
"side bite", etc. So on dirt, there are many ways to win on a
particular track and surface.
The Suspension Analyzer just calculates all the suspension geometry in great detail, like roll center, camber gain, roll stiffness, roll steer, bump steer, etc as the suspension goes through dive, roll and steer. Those calculations have nothing to do with the track surface. However, what kind of geometry you WANT (roll center, camber gain, roll stiffness, etc), CAN change from asphalt to dirt. You have to decide if your modifications will change the suspension geometry the way you want.
for another FAQ about Dirt vs Asphalt.
Back to Top
In the Roll Center Calculator and Circle Track
Analyzer, how do I measure where the Frame Mounts for the A Arms are located?
We often get this question. This is a limitation of doing a front
suspension layout in 2 dimensions (like a flat sheet of paper) compared to doing
it in full 3 dimensions (3D) like done in our Suspension Analyzer. This is
best explained with the picture below.
Draw a line connecting the left and right ball joints. We call this the
"axle line". Draw a line connecting the front and rear frame
mounts. Where these 2 lines intersect, that is what the 2 D programs want
for a frame mount point. Both the X Right/Left (distance out from the car
centerline), and Y Height (distance up from the ground) are measured at this
point.
 (click image to enlarge v3.6 "More Details" screen shown here)
Click on blue link to view the "More Details" screen available in v3.6
of Circle Track Analyzer and Roll Center Calculator to precisely locate this
single point based on the 2 actual mounting points.
Do you have software which deals with Rear Panhard Bar
settings?
Our Circle Track Analyzer v3.5 or newer will automatically pick a
panhard bar height (actually rear roll center height) to produce certain changes
in handling to produce a "balanced" condition. This is done by
knowing other vehicle characteristics like front roll center height, front roll
bar specs and front and rear suspension geometry. From this it calculates
the Front Lateral Load Distribution or FLLD. This number along with front
to rear weight distribution is useful to determining how tight or loose the car
will feel at the apex of the turn.
These features are found by clicking on the Details and Find buttons on the
main screen in the " 'Transition' Handling Rating " section.
Back to Top
Why doesn't Circle Track Analyzer showing a change in
lap times when I change suspension settings?
Which suspension settings are optimum and how they affect lap times depend on
many things, many of which we just don't know. These include the track
surface, driver preference, tire performance curves, etc. We are not able to
predict changes from suspension settings ACCURATELY enough at this time.
Therefore, we believe it is better not to try and to show NO effect at all. You
will see the demo or program make this VERY apparent in the Suspension Specs
menus. We would like to be able to predict all effects accurately for anything
you can change in the program, we're just not there yet.
Back to Top
When the Roll Center gets close to ground level, it moves
left or right dramatically for small changes in dive and/or roll. Is this
correct?
The program IS calculating the Roll Center position correctly MATHEMATICALLY.
When both instant centers are at approx. ground level (0.0 height), minor
changes will move the Roll Center left or right considerably, but not change the
height much. Most circle track cars are set up so the instant centers and Roll
Center stay well above ground, so this does not become an issue.
This brings up a debate about Roll Centers. How critical is the position left
or right. Some "authorities" only use the Roll Center HEIGHT to
determine handling characteristics. Most experts agree that asymmetries in
spring and wheel rates left and right have a large effect on how the body rolls.
This contradicts the simple Roll Center theory that says the body rolls about
the Roll Center, and spring rates have no effect. Performance Trends is simply
showing you the mathematical roll center and letting the user decide how to use
it.
Back to Top
Can the Circle Track Analyzer be used for dirt track
racing?
Many aspects of the Circle Track Analyzer are equally applicable to asphalt
or dirt. For example, Roll Center, Camber Gain, etc only depend on the front
suspension layout, not the track surface. However, what Roll Center or Camber
Gain you decide to run is your decision.
The program's lap times are based on the basic theory that you get your
best traction (fastest lap times) right before the tires break loose and start
spinning. This is definitely true on asphalt, and on many types of dirt tracks
also. However, the program does not simulate any conditions where you are
breaking the tires loose and "steering with the throttle". There are
also some recommendations (springs, stagger, etc) the program can calculate and
these ARE for asphalt.
for another FAQ about Dirt vs Asphalt.
Back to Top
The programs let me put in Dive and Roll
to watch what happens when the suspension moves. How much should I tell
the program?
This is a common question. First, this is an additional feature we
offer. You don't have to use it. Suspension programs from other
companies only do
the static calculations at ride height, because putting things in motion is much
more complicated.
Typically what you want is the roll center height not to move around too
much. Ideally the roll center goes up and down with dive. For
example if you go into 1" of dive, the roll center height will also move
down 1". This not an exact rule, but a trend to look for. So
you put the suspension though various amounts of dive and roll and watch the
general trends in roll center position.
The only real way to know the exact dive and roll of your vehicle is with shock sensors and a data
logger, like our DataMites, but that is
expensive. Reading commercial shock travel indicators can give you some idea of what's happening on the track because
they indicate maximum travel. (Using tie wraps tied to the
shock stems is another method, but that only shows you max compression.) However, if the right side is down 1"
and the left side is up 1" at the same time, that is a lot of roll and not
much dive. If the right side and left side are both down 1" at the
same time, that is a lot of dive and not much roll.
If all you have is shock travel indicators, I would recommend moving the
suspension through all extremes of those travels, making sure you put the car
through the most roll possible with max down on one side with max rise on the
other. If you have coil-overs, watch the shock/spring compression in the
program to match your travel indicators. In the picture below, with
separate springs and shocks, watch the shock travel as shown by the blue arrows,
negative means compression.
Realistically, the actual roll is about half of going to these extremes. If
max rise on left is 1" and max dive on right is .75", and the roll from
this condition is 3 degrees, realistically the car probably goes through only
1.5 deg roll.
If you know nothing about your car, use these suggestions for roll:
- Circle Track Big Bar, Soft Spring (BBSSS) setup on flat track: 1.0
deg roll
- Circle Track Conventional setup on flat track: 2.0 deg roll
- On high bank tracks, you will likely see less roll.
For dive estimates, most circle track cars are setup to let the car dive a
specific amount, either to the bump rubbers, or to within a certain distance to
the track. Use this difference in ride height to be the amount of dive you
enter.
Back to Top
Can you explain the
different labels for the 5 Link rear suspension points?
The 5 Link rear suspension type has 10 linkage points, so it can be quite
confusing what each point is called. The 5 points mounted on the spindle
(which the wheel bolts to) are called "Ball Joints", except for the
toe link which is called "Tie Rod on Spindle". The other 5
points are called out as "on Frame" because they mount to the frame or
chassis. Figure A 6.17 on page 153 in the manual shows this suspension
type with some explanation. Here is a portion of that Figure with the 10
labels used for each point.
 click image to enlarge it
Back to Top
What should I use for the
vehicle's centerline when I measure my suspension?
When you measure you suspension, the X measurement is measured out from the
centerline of the car. Many users ask "What should the centerline
be?" It could be the engine and driveline's centerline, midway
between the 2 frame rails, midway between the 2 tire patchs, and many more.
The most proper answer is midway between the 2 tire patches. However,
if you use this, and change wheel details like offset, tire size, camber, etc.
this centerline will change. Luckily, our suspension programs have edit
features to move all the suspension points left or right with one command.
They also have a handy "Center Car based on Tire Tracks". This
one command lets you recenter all the measurements if the track from left and
right are different.
Now for some reality to make your life easier. If you move the points,
say, 1" to the right, the only calculated result which changes is the roll
center location left/right (not height). Camber gain, ackerman, bump
steer, roll steer in the rear, and most everything else does not change.
And, a 1" or 2" change on roll center location left or right is not a
significant effect for handling. The height is much more important as it
affects the jacking forces.
So, what this means is we recommend you use something which is very stable in
the car, like the midpoint between the frame rails, or the driveline
centerline. Ideally the car is square so that either of these center
points at the front of the car and close to being the centerline at the rear of
the car. Then if you change camber or tire offset, you do not have to
change any other measurements, just the Track measurement. But, should you
ever want to change the measurements, to center them on the tire patches, the
single Edit command should allow you to do this.
In the picture below you will see the right track is 36.63" and the left
track is 30.63 inches (bottom of pic), so the front of the car is not centered
on the tire patches. If you click on Edit, then Move Groups of
Measurements in the new screen, you will see what the program will do to center
the vehicle on the tire patches. Click "Move Points" button to
have this modification performed. Note: The program will not
automatically center the other end of the car. You will have to make a note of
what happened at the front of the car, then move the points the same direction
and amount at the rear of the car.
 click image to enlarge it
Back to Top
How can I graph data from my
front suspension with that from a rear suspension?
The program is designed to graph data from the end of the car you are working
with on the main screen, before you click on the 'Graph' feature in the upper
left. So it will not graph rear suspension data with front suspension
data.
However, you can use a powerful feature to do a "Selective Open" of
the rear suspension file and open the Rear Suspension of this file as a Front
Suspension, and then do the graphing. First, create a new file name that
will hold the Rear Suspension data as a Front Suspension. Click on File,
then New.
 click image to enlarge it
In the "Start a New Suspension" screen, enter a name for this file.
 click image to enlarge it
Back at the main screen, you will see this is the new name of the file you
are working with. Click on File, then "Open (from all saved
suspensions)". Find the file with the Rear Suspension data you want
to graph with the other file's front suspension. Check the "Yes"
box for "Selective Open" and follow directions in picture below.
 click image to enlarge it
Now this rear suspension data is on the front end of the car for this new
file. Now you can graph the "front" suspension of this file,
with the actual front suspension of the other file, as shown below.
 click image to enlarge it
Note: The "Selective Open" feature is very powerful.
This FAQ just shows one handy thing you can do with it.
Back to Top
Dyno DatateMite Data Logger Questions
I'm building an inertia dyno
myself. How do I figure out how big to make the flywheel, or the roller
for a chassis dyno?
Performance Trends has created 2 simple programs which let you approximate
the size of flywheel for an engine inertia dyno, or roller(s) and any additional
flywheel for a chassis dyno. This is the best method to get you close to
the approximate sizes and weights.
for the program to estimate a flywheel for an "engine only" inertia
dyno.
for the program to estimate a roller size (and any additional flywheel) for a
chassis inertia dyno.
Diagram of some of the measurements used by these programs.
 click image to enlarge it.
Some of the assumptions used by these programs include:
- The engine accelerates through 50% of its RPM range for its test.
For example, if you run your test up to 6000 engine RPM, it assumes you
started at 3000 RPM.
- The programs assume no losses in the driveline, engine inertia effects,
etc. This means the acceleration times will likely be somewhat longer
than what is calculated.
- You need an acceleration time of 5 to 10 seconds for good accuracy.
- If you tell these programs you will run the dyno to 2000 RPM or 140 MPH,
then you must do that to obtain the acceleration times calculated. If
you run the test to a lower RPM or MPH, the acceleration times will be
significantly shorter, producing less accurate results.
----------------------------------------------------------------------------------------
If you want to go into more detail, then you need to do the following 4 steps
using the Dyno DataMite 10 day demo program from the link below:
to install the Dyno DataMite demo program
1) Run DataMite program and open an example data file with an inertia dyno.
Click on File (upper left corner), then Open from All Saved Tests. Click on the Examples folder in the lower right corner, then Black Box II in upper
left corner, then Open button in lower left corner.
2) Click on Dyno at top of main screen.
Make sure "Sections in Main Wheel" in upper left is set to 1
Make sure "# of Main Wheels" in upper right corner is set to 1
For "Main Wheel, section 1", enter 0 for Inside Diameter, Material to Steel.
Then set a Outside Diameter and Width (len) for a flywheel you would consider building. Program will calculate Weight and Inertia for this
flywheel. Especially note the Inertia.
(For chassis dynos, be sure to set one of the Chassis Dyno types in the lower left corner.)
3) Click on "Est. Required Inertia" at the top.
Enter the Average Torque for the highest HP engine you are likely to test. Estimate the Average Torque as follows:
Average Torque = Peak HP x 5252 / Peak HP RPM
For example, if your engine makes 75 HP at 8000 RPM, it would be:
Average Torque = 75 x 5252 / 8000
Average Torque = 49 ft lbs
Enter the Starting RPM and Finish RPM for the proposed dyno run, and the Desired Accel Time in seconds. For you highest HP engine, you should
probably enter 6 seconds, so that for your smaller engines the accel time
would be longer than 6 seconds. Ideally, you want the run to be around 8-10 seconds.
Enter possible Total Gear Reduction to keep the Maximum RPM (Calculated at the top) low and safe, and the Safety Factor high (ideally 8 or higher).
(For chassis dynos, a calculate vehicle speed will be displayed also. Adjust the Total Gear Reduction so that you get the approx MPH/KPH for the gear you will be testing at for the highest RPM for the test. The faster you can safely test at, the lower will be the required inertia.)
In the top section you will see the accel time for your current flywheel, and now much inertia (not weight) is required to get the accel time you
want.
4) You may have to go back and forth several times to come up with combinations that work for you.
Back to Top
I'm having trouble getting my
USB DataMite to "talk" to my computer. How can you help me?
Getting a USB device to communicate typically requires a USB driver to be
installed. This driver is on the Performance Trends blue CD.
When I start my engine (or go
to full power), I lose communications with my data logger. How can I
troubleshoot this?
If you have good communications without the engine running, but lose
communications when the motor starts or goes to full power, the reasons are
likely:
- Vibration is causing intermittent connections in the cables, most likely
the USB or serial cable connecting the logger to the computer. This
could be the case if the logger box is mounted on the dyno stand itself,
which is not a good practice if it can be avoided. Exposing the data
logger to excess vibration is just asking for trouble eventually.
- Electrical noise from the ignition system is creating
"confusion" in the data logger or the PC. Here's a list of
things to try to troubleshoot electrical noise.
When troubleshooting, it is important that we are trying to temporarily
find the source of the problem, and not the final fix yet. You
may think what we suggest is not a good permanent fix, but lets first
diagnose the problem The ways to troubleshoot the source of the
electrical noise include:
- See if you can watch the current readings screen for 2 minutes or more
with no loss of communications. This is to ensure the problem is
actually caused by the motor running.
- Disconnect some or all the sensor cabling from the data logger box and
see if you can start the engine now and not lose communications. Be
sure to mark the connections so you plug them back into the proper
connector. For example, on a DataMite III or 4, you can disconnect
Analogs B breakout cable and eliminate up to 5 sensors at once. If the
data logger keeps communications now, plug in the connectors 1 or a few at a
time to narrow down the problem connector or sensor. Any sensor or
cabling which goes close to an ignition component like a coil, spark plug,
ignition wire, distributor, etc could pick up noise spikes and
"confuse" the data logger.
- Check the Power Volts in Current Readings to ensure it is around 11-17
VDC. If it is not, investigate why.
- Move the PC farther away from the engine, especially if the PC gives an
error message that seems unrelated to the DataMite program. The PC
should be a minimum of 5 ft away from the engine, but 10 or more ft is
better.
- Move the data logger farther away from the engine. The data
logger should be a minimum of 5 ft away from the engine, but 10 or more ft
is better.
- Reduce the size of the Current Readings screen if it is maximized to
fill the entire screen. The larger the display, the more computer
resources it takes to run everything.
for info on a related FAQ.
- Click on Options at the top of the Current Readings screen and reduce
the Update Rate (probably at 10) to something slower.
for info on a related FAQ.
If you still are having trouble, call or email Performance Trends for
assistance. Note: If this is a system more than 1 year old, there
may be a nominal tech help charge.
for info on a related FAQ.
Back to Top
Do you have classes to teach user's
all of the DataMite software's features?
We don't have classes. However, we do have about 20 narrated, movies
for you to watch, 6-12 minutes each. Click on the blue links to:
How do I hang weights on
my dyno for calibrating the load cell for torque?
Appendix 5 in the Dyno
DataMite Users Manual (click on blue link) provides good information on
calibrating your load cell to read torque, or calibrating most any sensor.
It involves hanging a known amount of weight a known distance out from the
center of the dyno. However, there are some details the manual overlooks.
1) How do I account for the torque put on the dyno by just bolting the
calibration arm in place?
The manual talks about using a balanced arm which puts no torque on the dyno
when installed, or an arm which is permanently attached (which puts an offset on
the torque, but the calibration procedure corrects for the arm). However,
most people bolt their calibration arm to the dyno only for calibration, and
then remove it. If this arm is very long, this amount of torque can be
very high, 50 to 100 ft lbs or more. A long arm has the advantage that you
do not need a lot of weight to generate a lot of torque.
To determine the amount of torque put on the dyno from the arm, you must
first determine the center of gravity (CG) of the arm. This is done by
finding the approximate location where the arm will balance. See figure
below. This does not need to be done exactly, as that is quite difficult
and time consuming. Accuracy within a quarter inch is typically
sufficient. Mark the CG location on the arm. Then weigh the
arm.
 (click image to enlarge it
The amount of torque from the arm is the distance the CG is out from the dyno
in feet multiplied by the weight of the arm. In the figure below, with the
arm mounted to the dyno, the CG measures 34 inches out from the center of the
dyno, and the arm weights 79 lbs.
34 inches / 12 = 2.83
feet (12 inches in a foot)
Torque from Arm = 2.83 feet x 79
lbs = 223.8 ft lbs
 (click image to enlarge it
Then for the higher torque, you hang 320 lbs (four 80 lb plates) out at a
distance 55.5 inches from the center of the dyno
55.5 inches / 12 = 4.625
feet (12 inches in a foot)
Torque from Weights = 4.625 feet x 320
lbs = 1480 ft lbs
For this higher torque, you must then add the torque from the weights to the
torque from the arm for the total calibration torque
Higher calibration torque = 1480 + 223.8 = 1703.8
These would be the torques you would enter into the Dyno DataMite's sensor
calibration screen for torque, as shown in figure below. The voltages
shown on the calibration screen are obtained by clicking on the Read button for
the 2 conditions, arm by itself producing 223.8 ft lbs, then arm with weights
producing 1703.8 ft lbs.
 (click image to enlarge it
Because it may be difficult to fabricate a long arm, or you may not have room
for it, or you do not have much weight to hang, you may be tempted to only
produce a small amount of torque during the calibration. For example, you
test engines in the 500 ft lb range, but you only calibrate by hanging 60 lbs on
the dyno, 1 ft out. See figure below. In this situation, the arm by
itself produced 20 ft lbs. Then the arm plus 60 ft lbs produced 80 ft
lbs. This is much lower than the 500 ft lbs you test
at.
In a perfect world, with no errors, this would work fine. The
calibration in the 80 ft lb range would extend out to the 500 ft lb range with
no problem. However, in the real world, every data point has some error in
its reading. The figure below shows the calibration points of 20 and 80 ft
lbs with some error, and how that error gets multiplied many times by the time
you get to 500 ft lbs. However, when the higher torque calibration point
is in the 500 ft lb range, the calibration error in the 500 ft lb range is much
less.
This is the same reason the sights on a rifle are separated by as much
distance as possible. If the sights were only separated by 3", the
aim and accuracy for hitting a target at 100 yards would be 10 times worse than
with the sights separated by 30".
 (click image to enlarge it
Notes:
There is nothing "magic" about having the weights hang exactly 1 ft
out. Any distance will do as long as you know it exactly.
There is nothing "magic" about using something called a weight for
calibrating. A cylinder head which has been weighed on an accurate scale
works just as well. However, make sure your weight can not change. A
head with valves may weight 60 lbs today, but if someone takes out the valves
and springs, may weigh 57 lbs the next time you use it.
Pay attention to the volts generated by the 2 calibration points. If
they are only separated by 0.5 volts or less, your calibration is not as
accurate as could be. Also, if the volts at the higher reading is 4.5
volts or higher and you test at a torque in the higher torque point range, you
may be starting to max out the signal. Due to the pulsing nature of the
torque signal, 500 ft lbs can be pulsing from 400 to 600 ft lbs. If 550 ft
lbs is equal to 5 volts, all torque values greater than 550 ft lbs are being
lost and your torque reading is reading too low.
Back to Top
My torque reading is not
reading zero with the engine not running. How can I rezero the torque (or
most any analog channel) reading?
First, was your torque reading zero correctly before and now it is not?
If yes, check the following:
- With the engine not running, pull up on the load cell arm and let go and check torque reading. Then push down on the load cell arm and let go and check torque reading. Do they repeat? If not, there could just be
"sticktion" in the system, which typically goes away once engine is running (lots of vibration). The actual zero is likely half way between these 2 readings.
To see what the actual zero reading is with the engine not running, start
the engine with the dyno disconnected so the dyno sees no torque and see
what zero torque reads.
for FAQ below describing how to calibrate with sticktion in the
system.
- If you go back and hang a weight, is the upscale torque off by the same amount as zero? For example, if zero is reading +10 ft lbs when it should read 0, and you hang weights to produce 450 ft lbs, does it also read 10 ft lbs high, or 460 ft lbs. If yes, then it makes sense to rezero per the attached procedure?
to read how to "rezero" the sensor through the software.
If the torque reading is not reading zero correctly after you have recalibrated
(hung weights), check the following:
- Did you calibrate your system (hanging weights), as described in Appendix 5?
- Did you calibrate your system (hanging weights) with a load arm installed, and have now removed the arm? If yes, this would change the calibration you arrived at with the arm installed.
- When you calibrated, did you click the "Read" button with both zero torque (or some low torque number) and with a high torque? You need to read 2 torque settings to calibrate, one very low (typically zero) and one high.
for details on how to correctly hang weights to calibrate your dyno.
Back to Top
When
hanging weights to calibrate torque, the numbers can change by how I hang the
weights. How can I be more accurate?
To calibrate the load cell on a brake dyno, you will hang weights as
described in the FAQ above. If you find the voltage the computer reads can
change depending on the "sticktion" mentioned in the FAQ above (push
down, let go and read voltage, pull up and let go and read voltage), you should
first see if you can find the source.
for FAQ above describing sticktion. With a hydraulic load cell, the
seals in the hydraulic cylinder can cause sticktion because the piston must move
slightly to produce pressure. With an electronics load cell, there is
typically only a few thousandths of an inch of movement with load so sticktion
should be less of a problem. See if you can find the source, maybe binding
in the mounting ball joints, perhaps the cable, maybe movement in a rubber
mount, etc.
If you can not find and eliminate the sticktion, the next best thing is to
try to calibrate in the middle of the sticktion range, which is most likely the
signal produced when the engine is running and vibrating the load cell.
This is done as follows:
- With zero torque on the dyno, push down on the load cell arm and let
go. Click the Read button for "1st Value, volts" and write
down the voltage. Then pull up on the load cell arm and let go.
Click the Read button for "1st Value, volts" and write down the
voltage. Do this pattern 2 more times for a total of 6 readings.
If there is sticktion, the 3 pull up voltages should be very close together
and the the 3 push down voltages should be very close together, something
like: pull up readings of .288, .286, .289 and push down
readings of .298, .297, .300. Average all 6 readings together and
manually type in the resulting voltage of .293. See picture below.
- If you got a set of 3 voltage readings for pulling up of .288, .286, .308,
you would see that the .308 was way different than the other 2 and was even
higher than the 3 pushing down readings. This is probably a bad
reading and you should take another pulling up reading to replace it.
- Then hang the weight for the "up scale" torque reading described
above and go through the same process. Manually write down the 6
readings, check that the pattern repeats and the readings are very close
together, average all 6 readings and manually type in the voltage.
Back to Top
How do I know what
A/F to shoot for when I change fuels?
Air to Fuel Ratio (A/F) is a ratio of the mass of air burned in the engine to
the mass of fuel. Different fuels require a different A/F because of the
chemical composition of the fuel. For example, methanol engines require
about 2.5 times as much fuel as a gasoline engine requires.
Oxygen sensors don't actually measure the A/F ratio, they measure the
richness of the mixture. In a gas engine, 15% rich (a good rule of thumb
for best power) is about 12.5 A/F. In a methanol engine, this is about 5.5
A/F. Both engines are going to make good power at about 15% rich.
Because different fuels require different A/F, and especially with the advent of
the ethanol blends with gasoline, E10 (10% ethanol at the pump), E85 (85%
ethanol at the pump), etc., a different measure of richness was developed.
It is called Lambda, or the excess air factor. A lambda of 1.1 means there
is 1.1 times as much air as required, or 10% more. A lambda of .85 means
there is 15% less air than required, or there is about 15% excess fuel. A
lambda of .85 or 15% rich is also a good number to shoot for for best power.
See the chart below for an explanation of different A/F for various fuels.
 (click image to enlarge it)
So, what do you use for the A/F calibration for your sensor for various
fuels? If you want to keep it simple, keep the A/F calibration set to the
gasoline calibration and shoot for about 12.5 A/F even if running different
fuels. When you are running methanol, the "true" A/F will be
more like 5.5 when the gasoline calibration says 12.5, but 12.5 using the
gasoline calibration is still 15% rich.
Think of A/F as room temperature. A room temp of 35 deg C sounds very
cold to us Americans, until you convert it to its equivalent of 95 deg F.
Both feel equally hot, just measured on different scales.
Now if you want to be more correct, and if a Lambda calibration is available,
start reading A/F in lambda. This will be easier to understand because it
is constant over all A/Fs, you want to shoot for about .85 lambda. And you
don't have to worry about the "know it all" looking over your shoulder
saying your 12.5 A/F on the gasoline scale is all wrong for methanol fuel.
If you always run the same fuel, pick the calibration for your fuel and keep
it there and shoot for the best power A/F for that fuel from the chart
above. If you are very familiar with the proper A/Fs for different fuels,
then change the A/F calibration for each new fuel you run and shoot for the best
power A/F for that fuel from the chart above.
The Dyno DataMite v4.1 has the correct calibrations for different fuels, and
lambda, pre-programmed for the various oxygen sensors we use for easy choosing.
Back to Top
Can the DataMite
software use vehicle coastdown data on a chassis dyno to estimate driveline
losses, and therefore produce flywheel torque and HP numbers?
The Enterprise Edition of the Dyno DataMite v4.1 vA.040 or later provides an additional test Type of
"Measure Tq/HP from accel/decel". This test Type is only for chassis dynos
with a test run consisting of an accel followed immediately by a decel with no braking of the vehicle.
This coastdown info after the accel is use to estimate vehicle and dyno losses and better estimate flywheel torque and HP.
The graph below shows what this type of run looks like, with Dyno RPM vs
Time. Note that the accel took only about 6 seconds but the coastdown
portion took over 60 seconds.
When you identify a test like this and make a run as described, there are 4
new types of Graph Data types available:
- Coastdown Torque
- Coastdown HP
- Total Corrected Torque
- Total Correct HP
Total Corrected Torque and Total Correct HP are the estimated values at the
engine flywheel. Coastdown Torque and Coastdown HP are the losses
calculated from the vehicle coastdown portion of the test.
Total Corrected Torque = Corr. Flywheel Torque + Coastdown
Torque
Total Corrected HP = Corr. Flywheel HP + Coastdown
HP
where Corr. Flywheel Torque and Total Flywheel HP are the numbers
typically reported from the chassis dyno results. "Flywheel"
means this is not what is recorded on the actual roller, which would be similar
for the HP, but very different for the torque because of possible gear
multiplication and roller vs tire diameter "gearing" effects.
Here's the screen for picking these new data types. Note the
"Corr. flywheel HP (after losses)" is also picked but farther up the
list.
Here's what the results look like, using HP as the data type.
Notes:
As shown in the RPM graph above, it is best if the accel portion and decel
portion of the test extend through the same RPM range.
If you are doing this type of test, the Coastdown data in the Dyno Specs to
estimate just the dyno losses are not used. That is because these losses
are also determined during the coastdown to determine the vehicle losses.
Doing a coastdown test of the vehicle you just tested to estimate the losses
in the driveline, to then come up with flywheel HP can be misleading. The
reason is because the losses with power ON are much higher than when coasting,
especially for an automatic transmission. For example, if the losses from
coastdown at 4000 RPM show 32 HP, the losses with full power will be much higher
(perhaps 100 HP for a 500 HP engine) when accelerating. Tire slippage will
be 3-10%, which equates to a direct loss of that percentage in power.
(During coastdown, tire slippage is 0%.) The difference between full power and
coasting gear box losses are the difference between power-On efficiency and
simple "spin losses". Therefore, the Total Correct Torque and
Total Correct HP are still not as high as what is happening at the
flywheel. But because several users have requested these results (because
other dyno systems perform them), we have also provided them.
Back to Top
When trying to achieve accurate
inertia dyno results, what are the main things to consider?
By accurate, I mean as close to true horsepower as possible.
-
Correct for weather conditions to some "standard
weather day". Engine power changes significantly with weather
conditions. You should record the weather conditions PROPERLY and
correct for them, typically done automatically with software. Also,
only compare results that are corrected to that same "standard weather
day".
-
Accurately account for all the inertia in the system.
This includes the inertia of the engine (crank, flywheel, etc). Again,
this is best done in software.
-
Accurately account for all friction in the system.
Friction includes bearing friction and windage of the inertia wheel spinning
in the air. This can be measured by doing a coastdown test, spinning
the flywheel system up and then letting it coast down with the engine
disengaged. Again, this is best done in software.
Note: A coastdown test does not account for all
friction. The friction losses when power is ON is higher than when
just coasting down. However, it is the best estimate we have of these
losses. Also see FAQ below, "...repeatable inertia dyno
results?"
-
Use a
clutch that locks up well below the RPM where you want accurate data.
If you want good torque and HP data at 3000 RPM, use a clutch that
locks up at 2000 RPM.
-
Try to rev as high as the
engine will safely live. If you want accurate data at 10,000 RPM, you
will need to rev to 10,500 or higher.
-
Use moderate acceleration
rates, like 300-500 engine RPM per second. Very quick acceleration
rates, like 1000 RPM per second are less accurate.
Back to Top
What are the main considerations when
trying to achieve repeatable inertia dyno results?
By repeatable, we mean test-to-test and day-to-day consistency
- Correct for weather conditions, as described above.
- Always start your run with the same engine temperatures. To most kart builders, this means head temp. However, block temperatures should also be included.
- Always do the same acceleration rate. With an inertia dyno this will happen automatically if you use the same gear ratio between the engine and dyno, use the same clutch (lockup RPM), and same starting RPM.
- Because weather correction factors are not perfect, always try to run critical comparison tests on the same day, same engine, same operator, etc. Don't try to say Cam A is better than Cam B because Cam B got better results on one day on a different engine than Cam A.
- Try to keep frictional losses as low and constant as possible.
- Flywheel bearings should be the same approximate temperature.
Cold bearings in the winter (before your shop warms up) have higher
losses than summer bearings where the shop is always above 80 degrees.
- For critical measurements, do not change the gear, chain, or belt
ratio. In a perfect world, this should not matter. However,
it appears that changing ratios can effect frictional losses.
- Keep the chain lubed and in good condition if chain drive.
- Keep the belt tension constant and the belt in good condition if belt
drive. V belts are typically less repeatable than flat, toothed
belts (like timing belts).
- Do repeat tests. Try Cam A, then Cam B, then go back to Cam A to see if it repeats, then go back to Cam B. This is a lot more work, but it is the only want to get a repeatable measure of what Cam B gets over Cam A.
for more tips for testing peaky engines.
Back to Top
What are the main considerations when
trying to achieve accurate and repeatable brake dyno results?
for tips to get accurate results for an inertia dyno. Most all these
tips also apply to water brake dynos.
for tips to get repeatable results for an inertia dyno. Most all these
tips also apply to water brake dynos.
for tips about checking the zero reading on your dyno before testing.
Check if there are things putting torque on the dyno other than the
engine. For example, in the picture below, the water hoses are going out
to the side of the dyno. As the pressure in or temperature of these hoses
change, the hose will stiffen or go slack, changing the torque preload on the
dyno from the hoses. The same applies to cables. If someone moves
the cables or hoses, it can change the preload torque on the dyno.
 click image to enlarge
A better system for the hoses and cables would be for them go go straight
back and be supported at a point behind the dyno. Then changes in the hose
or cable forces would only put thrust loads on the dyno. Note: The
hose or cable support should allow for some movement in the hoses and cables, so
they do not inhibit any rotation of the dyno itself. See pictures below.
 Click here to increase image of Land&Sea dyno with hoses to the side,
changing torque with changes in water flow and pressure. This introduces
errors in the torque reading, especially when doing small motors.
Click here to increase image of Land&Sea dyno with hoses to the side,
changing torque with changes in water flow and pressure. This introduces
errors in the torque reading, especially when doing small motors.
 Click here to increase image of Land&Sea dyno with hoses rearranged, nearly
eliminating effect of hoses on dyno torque and improving dyno accuracy.
Click here to increase image of Land&Sea dyno with hoses rearranged, nearly
eliminating effect of hoses on dyno torque and improving dyno accuracy.
With an inertia dyno, the acceleration rate is typically quite smooth and
repeatable because of the high inertia of the dyno. However, with the low
inertia of a brake dyno system, you need a repeatable control method to do
smooth and repeatable sweeps through the RPM range. Good control can be
done manually if you have good experience. Otherwise you will need some
type of controller, like Performance Trends' Dyno
Controller.
To help compensate for different acceleration rates from test to test, you
can correct for engine inertia effects.
for an FAQ on using engine inertia correction.
for the Dyno DataMite user's manual where you can check for "engine
inertia" in the index or doing a word search for that phrase.
for more tips for testing peaky engines.
Back to Top
When I dyno an engine using an
Inertia Dyno and your DataMite, the HP seems to peak too early, say 9,500 RPM,
when I actually rev the engine to 10,500 RPM on the track. Why?
There are several reasons:
For best performance you do want to rev the engine past the HP
peak. For best performance, you want to keep the engine in the highest HP
range available. This usually means revving past the peak, so the lowest
RPM on the track is still near the HP peak.
The dyno can only show performance for the RPM range you have tested.
In simplest terms, it can't show you torque and HP at 10,000 RPM if you don't
rev it to at least 10,000 RPM.
Most all dyno data looses accuracy near the point where you open or close the
throttle. This is usually the start and the end of the run. One
reason can be due to not knowing exactly where the throttle closes.
Another is that in the process of filtering (smoothing) data, the data happening
a small time before and after some event gets averaged in with the event.
This means that data at 9800 and 10,200 RPM gets averaged in with data at
10,000 RPM. Since 10,200 RPM may be very low power (closed throttle), it
will bring down the average data at 10,000 RPM. This filtering effect is
even more pronounced with inertia dynos, which must also diferentiate the
data. This means that data at 9,500 RPM and 10,500 RPM gets averaged in to
produce the result at 10,000 RPM. (The RPMs above are not exact, but are
just examples to illustrate the point.) The point is, to accurately see
what is happening at, say, 10,000 RPM, you should rev the engine well past
10,000 RPM during your dyno test. Note, however, you
must consider the safe RPM limit for both your engine and dyno !
Back to Top
The Torque Peak and HP peak reported on the Main Screen
is slightly different than what I see on the graph which is slightly different
than what I see on the report. Why?
This is still good information, but Version 3.2 (released around October
2002) provides a Preference to ensure the torque and HP filtering and RPM step
sizes for torque and HP are always the same, thus ensuring that you always get
the same numbers on the Main Screen, in the Graphs or in Reports. To set
this, click on Preferences, then "Graphing" tab at the top, then set "Specs for RPM Graphs and Reports" to "Increments/Filtering match Main Screen".
The torque and HP peaks are the highest values the program finds in the
data. However, the user must understand that the data has been arrived at
by doing a "bunch of math". For example, from an inertia dyno,
the data is dyno wheel RPM and engine RPM measured at various periods of time,
not torque and HP measured at various RPMs. For absorber dynos, the data
is volts measured at various periods of time. In addition, all
measured data has a certain amount of error associated with it.
In the process of doing the math, the program "smooths" or filters
the data to help reduce the effects of measurement errors and so the data looks
more like what the user expects. The Dyno DataMite program gives the user
a lot of freedom to choose the amount of filtering, and also the RPM increments
for reporting data. Both of these settings will affect the numbers and
therefore the highest number (peak number) you will see. The Figure below
shows a torque curve from an absorber dyno. You will see that the top
curve with the least filtering is also the "jumpiest" curve. It
has more highs and lows and therefore produces the highest "Peak
Torque" of 856 ft lbs at 5600 RPM. Applying some "Light"
filtering reduces the peaks and fills in the dips. Now the Peak Tq is only
849 at 5650 RPM. Applying "Heavy" filtering greatly reduces the
peaks and fills in the dips, to produce a Peak Tq of only 844 at 5450 RPM.
This is all with the exact same recorded data, just doing the math on the
data differently.
You will now ask "Which number is right?" and the answer is
"They all are, if you include the math which produced the
results." If we keep getting this question, Performance Trends may
need to take away the user's freedom to set various amounts of filtering and the
RPM increment size for reporting data. This would be to avoid confusion on
the part of the user. Currently, these are your options:
- Main Screen: Data is reported at the RPM increment and filtering
level specified in the Preferences menu.
- Graphs: Data is always graphed at 50 RPM increments, but 4 levels of
filtering are available in the Graph Settings screen.
- Reports: Data is reported at the RPM increments and 4 levels of
filtering are available in the Report Settings screen.
If you make the RPM increment size and filtering the same for the Main Screen
and the reports, you will obtain the same peak numbers. Graphs are done at
50 RPM increments (smaller than available with reports or at the Main Screen,
and therefore will be slightly different).
When you make comparisons from run to run, you must use the same filtering
and RPM increments to do so. That is why the best comparisons are done
with graphs, putting both or several runs on the same graph. Then you know
the RPM increment and filtering for all runs are exactly the same.
Comparing Peak numbers between runs is not a good way to compare runs.
Back to Top
Can I use just engine RPM or Dyno Wheel RPM (not both)
to calculate torque and HP?
Yes, there are several options. These options are set in the Dyno and
DataMite screens. The Dyno screen is available by clicking on Dyno at the
top of the Main Screen. The DataMite screen is available by clicking on
DataMite at the top of the Main Screen.
To use just Engine RPM for an Engine Dyno, select Dyno Type of
"Engine, No Clutch" and the Gear Ratio to the correct ratio (at lower
left in the Dyno specs screen). Then in DataMite specs screen, be sure to
change the Sensor & Calibration of the dyno wheel RPM to something other
than Dyno Wheel RPM, or set it to Not Being Used. Not finding Dyno RPM,
the program will use engine RPM and the gear ratio set in the Dyno specs screen
to calculate the Dyno Wheel RPM, torque and HP, assuming NO CLUTCH SLIP.
If you graph or report the Dyno RPM channel, it will show the actual recorded
Dyno RPM, not the calculated RPM.
To use just Dyno RPM for an Engine Dyno, select Dyno Type of
"Engine, No Clutch" and the Gear Ratio to the correct ratio (at lower
left in the Dyno specs screen). Then in DataMite specs screen, be sure to
set the Sensor & Calibration of the dyno wheel RPM to Dyno Wheel RPM.
If necessary, you can set Channel 1 (typically Engine RPM) to Dyno Shaft RPM in
the Pro version of the software.
Finding Dyno RPM, the program will use it and the gear ratio set in the Dyno
specs screen to calculate the Engine RPM, torque and HP, assuming NO CLUTCH
SLIP. If you graph or report the Engine RPM channel, it will show the
actual recorded Engine RPM, not the calculated RPM.
To use just Dyno RPM for a Chassis Dyno, select Dyno Type of
"Chassis, No Engine RPM" (at lower left in the Dyno specs
screen). Gear Ratio in the Dyno Specs screen now becomes disabled (grayed
out). Then in DataMite specs screen, be sure to set the Sensor &
Calibration of the dyno wheel RPM to Dyno Wheel RPM. In Test Conds, you
must set the correct gear ratios and tire size so the program can correctly
calculate the Engine RPM, torque and HP, assuming NO CLUTCH SLIP. If you
graph or report the Engine RPM channel, it will show the actual recorded Engine
RPM, not the calculated RPM.
If you have the Pro version of the software, you can get Calculated Engine
RPM to show up on the Current Readings screen on the gauges in
Preferences. If you have chosen one of the options above and are using
Dyno RPM, you can do the following: Click on Preferences at top of main
screen, then the Calculations Tab. Set "Engine RPM is Calculated
RPM" to Yes, then click on OK to keep this change. Now you can see
this Calculated Engine RPM on the Gauges if you select to display Engine
RPM. BE CAREFUL, because if you have entered too low a gear ratio in
the program, the Calculated Engine RPM will be too low and you will over-rev the
engine. Also, be sure to turn this off when you start to MEASURE Engine
RPM again.
Back to Top
How do I measure Engine RPM on a chassis dyno?
Because there are so many different engine ignition systems, we have
developed several methods to measure engine RPM.
DTM-IPU Inductive Pickup. This method involves tie wrapping a wire from
our harness to a plug wire or secondary wire from the ignition coil. We
have also had good luck placing this wire near the coil on a "coil on
plug" type engine.
DTM-IPUC Inductive Pickup Clamp. This method is the same as the DTM-IPU
above, but provides a "timing light style" clamp to clip to a plug or
coil wire. This can provide a cleaner signal than just the DTM-IPU with a
wire, but can not be used for "coil on
plug" type engines.
BB2-IPULV Low Voltage Inductive Pickup This sensor clips to a low
voltage wire, like the coil primary wire or fuel injector wire.
DT2-RPMR Reflective Optical RPM Sensor This sensor
"watches" a piece of reflective tape you will place on something
spinning at engine RPM, like the crank pulley or dampener. This method is
VERY reliable and universal, but requires with you coming up with a
bracket. The sensor has a red "pointer" beam which greatly aids
the setup process.
Calculate Engine RPM from Dyno RPM The software allows you to CALCULATE
engine RPM from dyno wheel RPM from simple vehicle measurements or from a simple
calibration test (Pro version of software only). This method assumes the
clutch and tire slippage is 0, so it does not work well with automatic
transmissions. The v4.1 software has new features to make this method even
easier than previous versions. Check the Dyno
DataMite v4.1 Supplement (in particular pages 248-250) for more details.
Back to Top
Can I use just your software with an existing dyno?
Our software only works with our electronics. You will need to install our electronics and sensors and then you can use our software. We do NO control of the
dyno at this time, which is very important with absorber (water brake, hydraulic pump, eddy current, etc)
dynos, either a chassis or engine only dyno. By control, I mean the system which holds RPM constant as you make changes to the engine or throttle, or the system which lets the engine accelerate at a slow,
continuous rate as you are making a power run. Being inconsistent at how
you let the engine accelerate during a run can lead to not-repeatable tests.
If you already have control with your dyno, you should keep that existing dyno system to do the control. Then add our sensors and electronics to do the data gathering, graphs, etc.
Back to Top
How does your software and electronics control the dyno?
How you control the dyno is very important
with absorber (water brake, hydraulic pump, eddy current, etc) dynos, either a chassis or engine only dyno. By control,
we mean the system which holds RPM constant as you make changes to the engine or throttle, or the system which lets the engine accelerate at a slow,
continuous rate as you are making a power run. Being inconsistent at how
you let the engine accelerate during a run can lead to not-repeatable
tests.
for info on our Dyno Controllers.
If you already have control with your dyno, you could keep that existing dyno system to do the control. Then add our sensors and electronics to do the data gathering, graphs, etc.
You could also continue to control your
dyno manually with the throttle and water control valve. You will continue
opening the throttle and applying load with the water control valve until the
engine is at WOT (wide open throttle) and at the starting RPM you desire.
This requires a little experience and practice to get good at it, especially
with high powered, turbo'd or "peaky" engines. You will adjust
the control valve to get the engine to either accelerate or decelerate at a slow
(100 to 300 RPM change per second), continuous rate through the entire RPM
range.
A big advantage of the inertia dyno is the "control" is near
perfect. You start at a low RPM, hit the gas (go to WOT or wide open
throttle) and the engine accelerates smoothly and consistently because of the
large amount of inertia in the system.
Back to Top
How will I run a test with a water brake dyno?
All absorber or brake dynos (water brake, hydraulic pump, eddy current,
either chassis or engine only)
tests are done as a "sweep" test, where the engine goes through its
full RPM range and the DataMite or Black Box system records the data at a very
high rate. When the test is done, then the software will report or graph
the data at standard RPM increments, like every 100 or 250 RPM, whatever you
select. This is much more accurate and efficient than trying to stabilize
at various RPM steps and then record data, then go to the next RPM step.
Check the other FAQs here about controlling the dyno, and section 4.3 in the
user manual at this link: PDFs/DTMMANL7.pdf
Back to Top
Is my load cell working in
tension or compression?
The load cell is used to measure the torque being absorbed by the dyno by
preventing the dyno from rotating. "S" beam load cells (shaped
like the letter S) can work in either tension or compression. Performance
Trends needs to know this when we wire up your load cell and amplifier.
Typically tension is easier to design for if you are making your own brackets.
Old fashioned load cells were hydraulic cylinders and worked only in
compression. So if you are replacing an hydraulic load cell with an
electronic "S" beam load cell in the same position, it will also be
working in compression. Check out the picture below to know if your load
cell is working in tension or compression. If your engine or dyno turns in
the opposite direction, the working of the load cell will reverse.
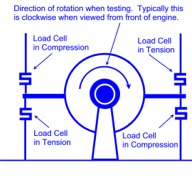 click image to enlarge
The load cell signal is typically from 0.3 volts to 4.3 volts. It is
possible to wire up a load cell to work in both tension or compression, where 0
ft lbs will be about 2.3 volts. Tension may have the voltage go down and
compression may have the voltage go up. However, if we wire it this way
you lose half the voltage scale for recording torque, which limits
accuracy. For this reason, we wire it for either tension or compression,
not both.
for info and parts for reversing the operation of your load cell if you want to
switch from tension to compression.
Back to Top
Can most of the USB DataMite III or 4 features be added later if I don't buy them
now?
There are 2 options to consider, which require returning the logger to add at a later
time:
Internal Weather Station Sensors, part number DT3-IWS: The weather station allows the DataMite software to automatically do weather corrections to the data exactly the same for each test. This helps produce more repeatable data. These sensors and fan must be installed and checked by Performance Trends, which means you must ship the unit back and we then ship it back to you. And the cost for doing this after the box is returned
is $25 more that doing this originally. When you include shipping costs
which can be expensive if shipping outside the USA, you may want to get this option right away and save all the shipping and extra expense.
Internal 4 or 10 Thermocouple Channels, part numbers DT3-TC4 or DT4-TC10: These thermocouple channels let you plug in inexpensive (typically less than
$60) type K thermocouples to record most any kind of temperatures. (You can add external thermocouple circuitry, but it costs more than
$215 to add just 2 channels.) This circuitry must be installed and checked by Performance Trends, which means you must ship the unit back and we then ship it back to you. And the cost is
$25 more for doing this after the box is returned. When you include shipping costs
which can be expensive if shipping outside the USA, you may want to get this option right away and save all the shipping and extra expense.
We are happy to sell to the system without thermocouples, but it is VERY nice to always have the
temperatures recorded the same way with each test. If you ever have a question, you can go back and look at the data and say "Yes, the head temp was the same" as some other test, not hope you manually recorded the temp for that test, but it could have just been carried over from the previous test. In just a couple of days, you will not remember. Also, adding a $35 inlet air temp thermocouple can make for better weather corrections, because the temp at the box can be different than temp going into the engine. Barometer and humidity are same at engine as at box.
Back to Top
How can I troubleshoot bad or "corrupt" data I'm getting from
the Black Box II Dyno System?
Take the top off the box, but leave the wires attached to the lid plugged into the board.
Make sure the ribbon cable connector from the computer connector is firmly plugged into the board connector.
If that was OK, then:
What happens if you just run a test without the engine running, just record data for 20 seconds and download it. Does this show up as corrupted?
If Yes, if you have an optical isolator, what happens if you repeat the step above without the optical isolator
in the system?
If not, then unplug all sensors from the box and run a test with engine running and download. Does this show up as corrupted?
Plug in optical isolator for tests with sensors hooked up.
If not, then start plugging in sensors 1 at a time (starting with dyno RPM) and run a test and download. Does this show up as corrupted?
What sensor being plugged in shows up as corrupted?
Let us know what happens when you try these tests.
Back to Top
Can you do a "coastdown" test on our chassis dyno to measure the
dyno and vehicle losses, and then correct the chassis torque and HP to get
flywheel torque and HP?
Doing a coastdown test of the vehicle you just tested to estimate the losses in the driveline, to then come up with flywheel HP is VERY MISLEADING.
Reason is because the losses with power ON are much higher than when coasting, especially for an automatic trans.
For example, if the losses from coastdown at 4000 RPM show 32 HP, the losses with full power will be much higher (perhaps 100 HP for a 500 HP engine)
when accelerating. Tire slippage alone will be 3-10%, which equates to a direct
loss of that percentage in power. (During coastdown, tire slippage is 0%.) The difference between full power and coasting gear box losses are the
difference between power-On efficiency and simple "spin losses". Torque
converter slip during power-On can be 30% or more, again a huge loss that is 0
when doing a coastdown.
Back to Top
How can I email Performance Trends a test from my DataMite software, for
Performance Trends to check out?
This is done by putting a floppy disk, memory stick, or writeable CD into the computer. Then click on File at upper left of main screen, then select Save to CD/Floppy Disk.
(If the drive letter does not match what drive letter you want to use, you can
change this in Preferences at the top of the main screen. Click on the
Filing System tab, then change the Default Floppy Disk drive letter. Then
click on OK button to keep this change.)
This will copy the 3 files which make up the test to the floppy or CD. Take
this disk to an email computer and send all 3 files to a Performance Trends
email address to evaluate. The Performance Trends tech will give you and
email address to send it to.
Starting with Version 3.7, there is an "Emailing" tab in
Preferences. Here you can set up your email properties so that emailing
can be more automatic. Then, at the main screen you can click on File,
then Email These Results and the program will email all 3 files
automatically. Once you have these properties set, you can also email
graphs and reports.
Back to Top
My Black Box II (or DataMite II) will not communicate to my
computer. What should I do?
Remove the optical isolator from the system if you have one. If this
fixes the problem, be sure to set the Preference to Enable Optical Isolator
power. If this is set correctly, then you may need a powered optical
isolator from Performance Trends.
Be sure you are using the cable supplied with the system, called a Null Modem
cable. Not all 9 pin cables are the same. You need one where pins 2
and 3 swap through the cable, pin 2 is connected to pin 3 and vice versa.
With the Black Box II, remove the lid (keeping all wires connected) and be
sure the ribbon cable from the computer connector is firmly plugged into
the connector on the board.
Click on DataMite at top of main screen, then Troubleshoot, then Check Com
Ports. Does your COM port pass the "paper clip" test? Can
you find a COM port which does pass this test. Note that COM 3 many times
may pass this test, but will still pass the test with the paper clip removed,
and is not a valid port. If no ports pass this test, you need to take your computer to a shop and have the Com Port activated correctly.
If you find a Com Port that does work, then note which Com Port Number. Click on Preferences at top of main screen, then General Operation tab, then set Automatically Find Com Ports to No. Then click on OK at top right of this Preferences screen.
Click on DataMite at top of Main Screen, then set the Com Port to the correct number you've just found.
Also be sure to have set the correct Type of DataMite to the correct type for
you system. Click on Back at the upper left corner, and say Yes to Saving these changes and Yes to Saving these changes as the Master
DataMite Specs.
Click on DataMite at top of main screen, then Troubleshoot, then Check Boot
Message and follow the instructions. Do you get a message from the Black
Box II or DataMite II? If yes, it means that you can at least receive info
from the box, but may not be able to send commands to the box. Contact
Performance Trends tech.
If you are using a USB adapter, check its status:
-Right click on My Computer, then click on Properties. The "System Properties" window appears.
-Click on the "Hardware" tab then "Device Manager". This gives you a list of devices on your machine.
-Look down the list for "Ports (COM and LPT) and click the "+" next to it. You will now see a list of ports on the machine. You should see a "Communications Port
(COMx)" (probably with "USB" mentioned also) where the "x" is the port #.
This is the port # you put in the DataMite specs screen.
Back to Top
What are the advantages and
disadvantages of an inertia dyno compared to a water brake?
An inertia dyno uses the inertia of a large flywheel or drum to absorb the
power from the engine and slowly accelerate through the RPM range. By
knowing the inertia and measuring the acceleration rate, torque and HP can be
calculated. An absorber dyno (water brake, hydraulic pump, eddy current, etc)
absorbs the power of the engine in some type of "pump" which raises
the pressure of the fluid, eventually turning the power into heat. The
amount of torque required to keep the housing of the "pump" from
rotating is also the amount of torque the engine is producing. Both
methods produce accurate results, but each has advantages and disadvantages.
Advantages of Inertia Dyno
- Very simple to build. All that is required is a shaft and a
sufficiently large flywheel to provide a slow enough acceleration rate for
accurate measurements. The power run should be 6-10 seconds ideally.
- You only need to measure dyno RPM and do not need a torque sensor.
- "Perfect" speed control. You start at a low RPM, hit the gas (go to WOT or wide open
throttle) and the engine accelerates smoothly and consistently because of the
large amount of inertia in the system.
- Because of the simplicity of the system and the "perfect" speed
control, the inertia dyno system can be extremely repeatable.
- The "bang for the buck" of the inertia dyno can NOT be matched
by an absorber dyno, especially for small engines.
Disadvantages of Inertia Dyno
- Can only measure performance while the engine is accelerating. You
can NOT hold speed at a particular RPM.
- Very large amounts of inertia are required for large engines.
Flywheels or drums weighing 1000 lbs or more may be required.
- Can be unsafe. Due to the large amounts of inertia and speeds
involved (especially for large engines), that is a lot of energy waiting to
be released should something break, or you slow down (brake) the system too
quickly.
- Can NOT measure the torque and HP at the exact beginning and end of the
run. In order to accurately measure the acceleration rate, we need to
know the engine RPM both some time before the current RPM and AFTER the
current RPM. At the end of the run, we don't know the RPM some time
AFTER the current RPM, because we never get to that RPM. What this
means is if you need to accurately know the torque and HP at 10,000 RPM, you
have to run your test out to 10,500 RPM or possibly 11,000 RPM.
Advantages of Absorber Dyno
- This system CAN measure performance while the engine is setting at a
steady RPM. This can be very handy when making tuning changes while
the engine is running.
- The system can be quite small and compact. All power is converted to
heat in the fluid, which is typically quite safe.
- You can bring the engine RPM down very quickly because there is so little
inertia in the system (very safe).
- It CAN measure the torque and HP at the exact beginning and end of the
run.
Disadvantages of Absorber Dyno
- More complicated and expensive to build. Large dynos require a lot
of water to absorb all the power from the engine.
- Needs a good torque (force) measurement system.
- Need good speed control to produce repeatable results.
- May require a lot of cool down time between runs once the dyno water
system gets warm.
- These systems can be very repeatable, but generally only if you spend a
lot of money, especially the control system.
Back to Top
Are there any general tips for building an inertia
dyno?
The following is a sample warning report which can be generated by the Dyno
DataMite program. It shows some specific RPMs and MPHs based on certain
sizes of components describing a particular inertia dyno system. These
limits will change for various dyno systems as you change critical dimensions.
------------------------------------------------------------------
The following are general tips to explain that if you are not careful, your dyno could turn into a 'bomb', injuring or killing yourself
and bystanders. As with any relatively high RPM rotating machinery, you should have the design checked by a qualified engineer.
------------------------------------------------------------------
The largest diameter in your dyno system is 30. inches.
It is recommended that you do not exceed 1333 RPM
There is no way the program knows exactly how your system is designed. Poorly designed systems should not be used at all, but should
definitely NOT exceed 1000 RPM, while well designed systems can operate safely to RPMs of 2000 RPM or higher.
Because Chassis dynos typically have relatively thin wall rollers (drums) and because of the speed limitations of the vehicle and tires, do NOT
exceed 92 MPH on this 23.0 inch diameter roller. That means do not test a vehicle to more than 92 MPH on its
speedometer.
More Chassis Dyno Tips:
- Chassis dyno rollers are more complicated to build and to analyze for safety than simple flywheels.
- Always note the tire's speed ratings and keep vehicle speeds well below the tires limits.
- Keep tires properly inflated for safety and consistent results.
- The smaller the diameter of the dyno roller, the more tire deformation, the more tire heat buildup and the more HP losses.
- Change transmission gear for testing to a lower one to keep the MPH low. However, if the run is over too quickly (accelerates too quickly), you can move to a higher gear ratio (but keep the top speed below all speed limits discussed above).
The important thing to note is that you want to keep the RPM low to keep your dyno system safe. A flywheel or chassis dyno roller can literally burst
if you over-rev it, or cause the entire system to start tumbling violently if something jams or brings the flywheel to a stop (brake) too quickly.
More tips include:
- Karting inertia dynos should NOT use hollow 1.25'' shafts. (Solid 1.25'' shafts are commonly used with 24''
diameter x 1.25'' thick flywheels, but even this is only marginally safe.
- Do not weld flywheels to shafts, unless the shaft is a large diameter.
- Use collars, hubs or flanges to avoid creating a stress riser right where the edge of the flywheel meets the shaft.
- Avoid very large, but thin flywheels. Do not use flywheels with a diameter more than 20 times the thickness.
- Put some type of 'cage' or containment around the flywheel to 'catch' a magnet which could fly off or to allow the flywheel to 'coast' down slowly (rubbing on the inside of the cage) should a shaft or bearing fail.
- Many inertia engine dyno operators like to use a one-way clutch, so the engine can come to a stop while the dyno wheel coasts down more slowly.
There are many more things to consider to make a dynamometer which is safe to operate. Be sure to consult other references like the Machinists Handbook.
Back to Top
Could you elaborate on the advantages
(carb tuning related) of the A/F sensor over BSFC?
BSFC stands for Brake Specific Fuel Consumption and is reported in pounds of
fuel consumed per hour, per HP. Very efficient engines at full power at
their torque and HP peak typically run about .40 to .45. This means the
engine requires .40 lbs/hr of fuel flow for every HP it makes. If it was
making 1000 HP, the fuel flow required would be 400 lb/hr (or approximately 1
gallon of fuel/minute, GPM).
BSFC is a measure of how well the engine is converting fuel into HP, NOT how rich the engine is running.
For example, if you retard the spark 20 deg, the BSFC goes higher (say from .40
to .50) because the same fuel is going in, but the engine is making less
power. To many people this is indicating the engine is richer. The engine is NOT richer, just less efficient at converting fuel into HP.
A major problem with fuel flow measurements (and therefore BSFC measurements) is fuel flow meters have a limited operating range. At the low end they get inaccurate or don't read at all. At the high end, they get restrictive, changing the fuel pressure significantly in the fuel line.
For example, for our popular 3/8" NPT fuel flow sensor would produce about 3-4 psi pressure drop in your fuel line at about 1500 HP on gasoline (about 700 HP on alcohol). However, below 350 HP on gasoline (170 HP on alcohol), it would not read accurately or at all.
The 1/4" NPT fuel flow sensor will read down to 15 HP on gas, but would produce 3-5 psi pressure drop at just 180 HP on Gas. At 360 HP the pressure drop is up to 10-20 psi. This
smaller sensor has proven to be quite restrictive.
Oxygen sensors for A/F have their own set of problems. The sensors degrade and get inaccurate with age and leaded fuel, any air leak or back flow from reversion make for inaccurate readings, etc. However, when they are working correctly, they are the best measure of how rich the engine is running.
Both A/F and BSFC are useful as long as you know the difference and limitations of each.
Back to Top
I have a 2 roller
chassis dyno. Do I put the RPM sensor on the front roller or rear roller?
There is a good deal of tire slippage and tire deformation which takes place
on a twin roller dynamometer. The RPM between the 2 rollers can easily be
10% different or more.
You must put the RPM sensor on the same roller as the torque
absorption unit. If this is a twin roller inertia dyno, put the RPM sensor
on the roller attached to the largest amount of inertia. This is typically
the front roller, because the tire will better adhere to it as the torque output
increases. The tire will tend to pull away from the rear roller.
Back to Top
What is meant by Master DataMite Specs and
Master Dyno Specs?
The DataMite Specs and Dyno Specs are critical for accurate dyno test
results. For each test you run, a copy of these specs are saved with each
test, and that provides for the following advantages:
- If you have found you have made a mistake (for example had the wrong
calibration for a sensor or wrong number of magnets for the dyno RPM
sensor), you can simply correct the mistake and the test is now
correct. You don't need to rerun the test with the correct
calibrations. This is VERY handy if you find a mistake once the engine
is off the dyno and down the road.
- If you make a change, like say you make your inertia dyno wheel (flywheel)
bigger, you want all new tests to use the new bigger flywheel. However
you want all your old tests to use the flywheel specs for that test.
By having separate DataMite and Dyno Specs for each test, it is possible to
do this.
- You may want to analyze (graph, report, etc) results from 2 very different
dynos. These may be your dynos, or may be a friends Dyno DataMite
results. By having separate DataMite and Dyno Specs for each test, it
is possible to do this.
Let's use example 2 above to explain the Master Dyno Specs. So, lets
say you are looking at an old test which was run with the smaller dyno
flywheel. If you go into the dyno specs, the program tells you these specs
were used for the old test (the current test you are looking at). However,
these specs do NOT match your Master Dyno specs, the specs for the larger
flywheel.
Now, if you start a NEW test, and this old test happens to be on the main
screen, you don't want the new test to use the old small flywheel. You
want it to use the Master Dyno specs which are for the larger flywheel.
The Master Dyno specs are the specs for your dyno settings right now,
today. The program is keeping track of the both Dyno Specs for this old
test and what dyno specs should be used for each NEW test (the Master Dyno
specs).
If you want to see the Master Dyno specs, just go into the Dyno specs and you
should get the message saying the current test's settings either DO or DO NOT
match the Master. If they match, then what you see on the screen are the
Master Dyno specs. If they DO NOT match, then click on File at the top of
the Dyno Specs screen, then Open Master Dyno specs. They will be loaded
for you to view. When you click on Back to close this screen, you are
asked if you want to Save these changes. If you just wanted to see the
specs, be sure to answer NO. If you DO want to use the Master Specs for
this test, like you are correcting a mistake, then answer Yes and the results
will be recalculated based on these new settings.
The Master DataMite Specs work the same. For the Road Race/Circle Track
and Drag Race DataMite software, the concept is exactly the same except the
Master Dyno Specs are replaced by Master Vehicle specs.
A very similar concept is used in our Port Flow Analyzer, Cam Analyzer, Shock
Dyno, and Spring Tester.
Back to Top
Should the density altitude go up with the humidity?
I've tried to read up on it but can't make perfect sense of it. Can you please explain?
Density Altitude is really a very old, nearly useless term which can have various definitions. It came about when
drag racers used aircraft altimeters to judge air quality. We give you 2
readings in the DataMite software, and other Drag Racing software.
- Density Altitude which only takes barometric pressure and air temperature into consideration, which is all old altimeters could do.
This should correlate with an old altimeter.
- Dry Density Altitude which also takes humidity into consideration, and is a much more useful and accurate term.
You will see that as humidity level goes up, the Dry Density Altitude also
increases, indicating poorer quality of air for producing power.
Back to Top
I'm getting erratic Engine RPM
readings. What can I do?
There are 2 types of "erratic" Engine RPM. One is where the
engine RPM can be perfect at some times or at some RPMs, and then do something
"crazy", dropping down to 0 RPM, or jumping up 10,000 RPM for a split
second, which we will call "erratic". The other is where
the engine RPM is constantly switching about 5 or 10 % between 2 different RPM
readings, which we will call "dithering".
Erratic RPM:
Engine RPM is critical for accurate dyno results, and can be measured most
conveniently by an inductive pickup sensor like a timing light. A very
common question we get is "We were getting very clean engine RPM and now
we're not. What changed?" Unfortunately, it could be most
anything, different engine, ignition or ignition components, plug gap, A/F,
spark advance, compression ratio, etc. Anything which affects how much
voltage it requires for the spark to jump the spark plug gap will affect the
"electrical noise" in the plug wire which is what we use to measure
engine RPM.
We have 2 different "clips", the standard inexpensive one DTM-IPUCW
and the optional, more expensive "timing light" style DTM-IPUC.
Prior to 2013 we used a different, smaller timing light style clip which was not
always better than the standard clip. Then we switch to a bulkier style
which did seem to be an improvement over the standard clip.
DTM-IPUCW
(standard)
DTM-IPUC (new,
better)
DTM-IPU (inductive pickup signal conditioning)
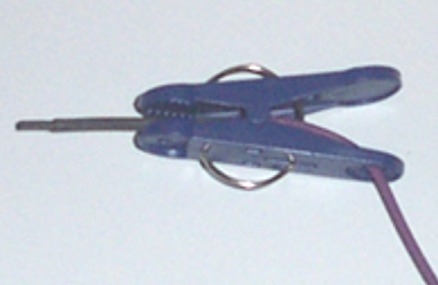
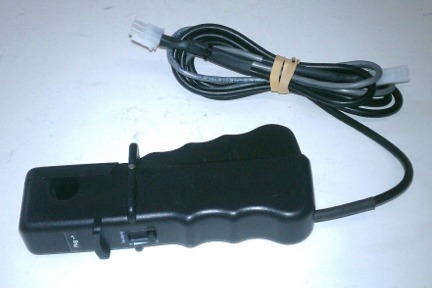

Both clips require the signal to be "cleaned up" by our Inductive
Pickup signal conditioning, DTM-IPU. It has a sensitivity adjustment knob, and its operation is described in this Inductive
Pickup Notes PDF document (click on blue link).
Other methods of measuring engine RPM include:
- Magnetic RPM Sensor
- Low voltage inductive pickup (to be picked up of 12 v primary coil wire or
EFI injector wire) BB2-IPULV
- Tach pulse signal (however this requires the logger to be grounded to the
engine and can cause other issues)
- Optical RPM Sensor
- Calculate engine RPM from dyno RPM, for both engine or
chassis dynos
- OBD2 engine RPM,
excellent for chassis dyno on modern street vehicles
to view a list of various styles of RPM sensors, with prices and pictures.
Suggestions: Here are some things to try to clean up erratic engine RPM
readings recorded via the inductive pickup.
- Make sensitivity adjustments to the inductive pickup, as described in this
Inductive Pickup Notes
PDF document (click on blue link).
- Sometimes the sensitivity knob does not provide enough adjustment.
To get an even stronger signal, wrap the purple wire around the plug wire 2
to 6 times. Some users report success with taping the purple wire
along side the plug wire (parallel) for 2 inches or more. Then you
still may need to fine tune the sensitivity with the knob.
- To check if the signal is too strong, remove the purple wire from the plug
wire. With the engine running and the inductive pickup turned to
highest sensitivity, hold the purple wire 12 inches away from the
plug wire and watch the RPM readings on the computer. Start moving the
purple wire close to the plug wire and note where it starts reading
RPM. If you have to get within 1/2" or less to the plug wire, it
is unlikely the signal is too strong. Then you still may need to fine
tune the sensitivity with the knob.
- For engines with 2 cylinders or more, move the inductive pickup and other wires away from other plug wires which
could "cross talk" to the plug wire you are measuring. See
pics below.
- Make adjustments in the DataMite III and DataMite 4 Preferences settings,
as described in DTM USB RPM
Preferences PDF document (click on blue link).
 click on image to enlarge and show graph of Inductive Pickup Engine RPM with and
without noise, and OBD2 RPM for comparison.
click on image to enlarge and show graph of Inductive Pickup Engine RPM with and
without noise, and OBD2 RPM for comparison.
The "fix" for the Inductive Pickup noise in the graph above was to
space the wire with the standard clip away from the other 2 plug wires on this
bank of a V-6 engine. There was also an adjustment to the Inductive Pickup
box sensitivity screw, making it less sensitive. The graph also shows that
the OBD2 Engine RPM was clean in both tests, but do lag the more accurate
Inductive Pickup RPM by about 0.1 seconds or so. This lag is not critical
unless you are doing very fast accelerations, which are not good for accurate
dyno testing anyway.
Standard Inductive Pickup clip, plug wires close
together
Moving this plug wire away from the other 2 with a shop rag fixed the problem
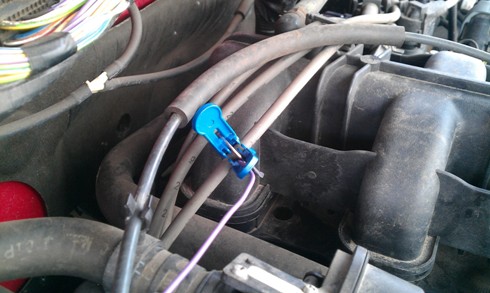
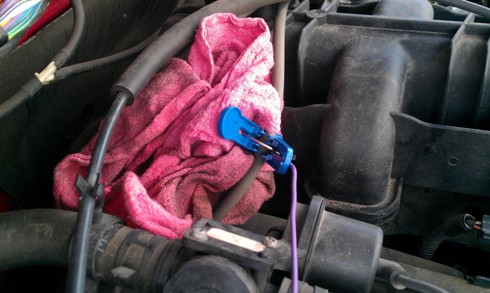
Dithering engine RPM:
This problem is much like having unevenly spaced magnets on a shaft or dyno
inertia wheel.
to read up on this effect.
Graph of dithering engine RPM sent by a customer
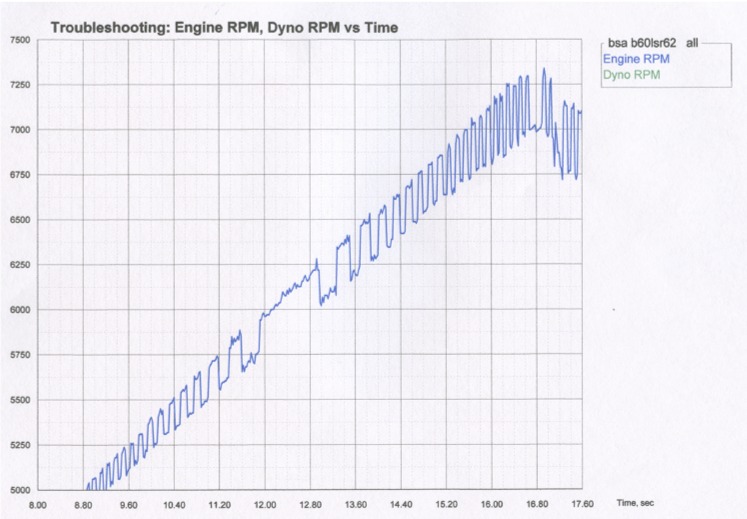
There are many reasons the engine RPM pulses could be unevenly spaced.
One could be the engine is unevenly firing, like a Harley Davidson or some early
Buick V-6 engines. Another could be due to a single cylinder engine
running "wasted spark" ignition. Here the engine fires every rev even though a 4 stroke needs spark only every
2 revs, which is the case in the graph above. What you are seeing is that sometimes the DataMite catches the power stroke (faster)
ignition pulses and sometimes the exhaust stroke (slower) pulses. This is random, but why you see the RPM jump between 2 different RPMs, a fast and slow one.
If you have a DataMite III or DataMite 4, there is a "fix" for this
"dithering" RPM. Go into the DataMite specs, click on the Sensor
and Calibration for the Engine RPM, and select "Every 2nd pulse" for
"Use Ign. Pulses", then click on Keep Calib. button to save this
change. Now the DataMite will ignore every 2nd pulse, and determine RPM
based on pulses that are evenly spaced.
Back to Top
I am trying to get Engine RPM from a coil-on-plug COP engine. What can I do?
If you have the Inductive pickup box, as described in the FAQ above, you need to remove the clip
from the purple wire. Then you can try to tie-wrap the purple wire to the
coil, to the spark plug, or just push the purple wire down the spark plug hole
getting it as close as possible to the spark plug. NOTE: Be sure
there is shrink tubing over the end of the purple wire or the spark plug could
"zap" the inductive pickup box. The newer inductive pickup boxes
(2014) are designed to prevent this, but nothing is perfect.
You can also try wrapping the purple wire around a fuel injector, which is
similar to a small ignition coil. If you do not get a signal, try
adjusting the sensitivity adjustment on the Inductive Pickup box. If you
go to max sensitivity and still do not get a signal, try wrapping the wire more
tightly around the injector, or wrapping it 2 or 3 times around the
injector. You may have to adjust the "x stroke, x cylinder"
setting for RPM to match the number of times the injector fires per
revolution. If once per rev, assign this as "1 cylinder, 2
stroke" or "2 cylinder, 4 stroke" which also fire once per
revolution.
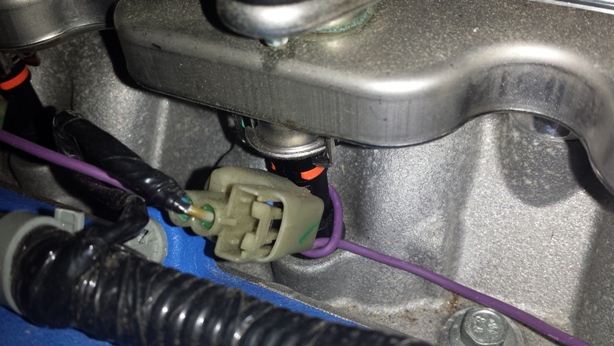
Back to Top
My DataMite will hang up (stop updating the
screen) during a dyno test. What can I check?
I'm going to suggest things for troubleshooting, things that are relatively easy to do to understand the problem. Do not assume these are permanent
changes. After each suggested change, resume dyno testing and see if the situation improves.
1) Reboot the DataMite and computer. Shut down and restart your computer and then restart the DataMite program. Before going into the Current
Readings screen, unplug both the USB cable and the power to the DataMite
box, wait about 10 sec and plug them in again, typically best to plug in power, wait 5 sec and then the USB cable. Wait about 10 sec, or about 5 sec
after you hear the USB connect tone before going into the current readings
screen.
2) The USB communications is very fast for our USB loggers, and the
standard USB cable is 10 ft long to keep the communications accurate. If
you are using a longer cable, or especially if you have added a USB extension
cable, this could be the problem. Go to the standard 10 ft USB cable and
eliminate any extensions to see if the problem improves.
3) Try setting sampling rate to 25/sec in the DataMite specs screen. The
screen below shows it set to the default of 50/sec.
4) Try reducing the size of the current readings screen. The
larger the screen, the more computer time it takes to refresh it. Click on
the 'Restore' button in the upper right corner as shown below if you have the
Current Readings screen maximized. If it is still large on the screen, try
shrinking the borders so it takes up less computer screen.
5) Try reducing the update rate for the Current Readings screen.
The default is 10 times per second. The picture below shows it reduced to
5 times per second. Try going even lower to understand what the problem
could be.
6) Try moving the DataMite and the computer farther away from the engine, especially the ignition system.
7) Try moving the sensor cabling farther away from the engine, especially the ignition system.
8) Try going to resistor plugs and plug wires.
9) When you are having a day when this is happening, close out of the Current Readings screen. Do a Ctrl-Alt-Del
(hold down the Ctrl and Alt key and then press the Delete key, then release
them) and see what else is running. Click on the Processes tab at top, then click on the "CPU" label at the top
of the "CPU" column 2 times. This will put the processes using the most CPU time at the top. Is something else running which is taking up a lot of CPU
time, or is "System Idle Process" 90% or more. It is possible something is
running in the background taking up lots of resources the DataMite needs
to properly record data.

for info on a related FAQ.
Back to Top
How can I use the
weather readings in my Dyno DataMite software to tune carb jetting at the track?
I've tuned my jetting on the dyno at some particular weather
conditions. Now I'm at the track and the weather is significantly
different. How can I adjust the jetting to bring the A/F back to where it
was on the dyno?
There are some issues to consider when rejetting a carb:
- A carburetor tries to hold A/F constant, but it does in
imperfectly. If you are not sure of what you are doing, it is probably
best to leave the jets alone.
- How your carb is designed has a lot to do with how you must change jets to
hold A/F constant for weather changes. This primarily has to do with
the power valve, it's size relative to the jet you will adjust and if there
is even a power valve present in the carb.
- Weather reading can vary significantly between weather stations, TV or
radio report weather data, etc. This is especially true of the
barometer reading, either observed or corrected to sea level. For this
reason, the best way to determine the rejet required it is best to use the
exact same software and weather station for all purposes. This would
mean taking your DataMite to the track and letting the Dyno DataMite read
the weather just like done on the dyno.
In v4.1 of the Dyno DataMite software we've added a feature to copy the
weather readings from a particular dyno test to the Windows Clipboard.
Then you can go to Performance Trends Weather Wiz program and paste these
readings into either the left side (baseline) conditions or the right side (new)
conditions.
If you are rejetting at the track, you would open a dyno test for the engine
when it was well tuned at the dyno, then go into Test Conds and click on the
'Copy' button in the Weather Readings.
Then open the Weather Wiz and click on the "<" button under Copy
from DataMite Logger label to paste these conditions as the Baseline
weather. You must also set up the carb parameters so the Weather Wiz
knows
what type of carb you are trying to rejet. There are other Jet options
under Options at the top of the screen.

Now you can read the weather readings from your Dyno DataMite software and logger
at the track, record a short test (even if the engine is not running) and paste
the track weather readings into the right side of the Weather
Wiz. The
Weather Wiz will give its analysis of how much the A/F will change with no rejet
or suggest how to rejet to bring back the same A/F you had on the dyno.
You can also use the Weather Wiz's own "stand alone" Weather
Station to read in the track weather automatically, or a different style
weather station and type in the track weather data (if you have a thorough
knowledge of the data it is reporting) to do the same rejetting calculations.
Back to Top
I have a dyno run
with noise spikes in the RPM signal which the program can not edit out.
What can I do?
The Enterprise Edition has a special "Advanced Edit of RPM Noise
Spikes" feature to let you manually cut out a section of data with noise
spikes and replace it will an "estimated RPM". Click on Edit
(upper left of main screen), then Advanced Edit of RPM Noise Spikes and choose
the RPM channel with the noise. A graph is presented of that RPM channel
vs time.
 click image to enlarge
 click image to enlarge
With the mouse, click and drag a box around the section of noise.
Note: Do not go much beyond the section of noise as the bigger the box,
the less accurate will be the new estimated RPM will be which replaces the
spikes. If necessary, do this 2 or more times if there are more than 1
section of spikes.
 click image to enlarge
That section of RPM data will be replaced by a straight line from the first
and last RPM data outside the box. Over a small amount of time, this
estimated RPM is sufficiently accurate for good dyno data.
 click image to enlarge
Back to Top
My RPM
measurements seem very jumpy. Why?
Jumpy RPM readings can be due to different things, like vibration, electrical
interference, etc. However, when there seems to be a repeatable pattern in
the "jumpiness" and you are using more than 1 magnet (or other
target), the problem is most likely the magnets are not evenly spaced. Say
you have 2 magnets on a wheel, which should be spaced 180 deg apart. If
you have them spaced 179 and 181 degrees and the wheel is spinning at a constant
2000 RPM, the RPM measured between 179 deg magnets is actually 2011 RPM.
The RPM measured between 181 deg magnets is actually 1989 RPM. Instead of
a steady 2000 RPM reading, you see an RPM reading jumping between 1989 and 2011
RPM.
 (click image to enlarge)
In the picture you will see a definite, repeatable pattern in the green wheel
RPM trace. The wheel has 4 magnets on it, making the job of getting all
magnets evenly spaced difficult. However, because these wheels are very
large, 4 magnets made the RPM measurement better because the RPM was quite
low. The driveshaft had only 1 magnet, so it was perfectly evenly spaced,
as shown by the blue trace.
Note on Inertia Dynos: Inertia dynos use the acceleration rate of the
inertia wheel to determine the power output. Acceleration is determined by
measuring the rate of change in RPM. If part of that change in RPM is caused by
the magnets not being evenly spaced, the acceleration rate can not be determined
as accurately. For that reason, we typically recommend using just 1 magnet
to eliminate this spacing problem, unless the RPM is very low. If the RPM is going to be less than about 500
RPM, we would recommend 2 magnets, and if the RPM is going to be less than 300
we would recommend 3 or 4 magnets on the wheel or shaft.
Back to Top
My Inductive
Pickup does not seem to read RPM. Why?
If could be that the ignition signal is too strong. Be sure to reduce
the sensitivity first to see if you start getting an RPM
reading.
If that does not produce any type of RPM reading, it could be the sensitivity adjustment of the Inductive Pickup does not go
sensitive enough. We put a 1K (1000 ohm) resistor in series with the
sensitivity adjustment pot (knob), so 1000 ohms of resistance is as low as the
sensitivity will go. If you are good with a soldering iron and
electronics, you can solder in another 1K resistor in parallel with the 1K
resistor there now, called R1. Now the sensitivity will be double of what
it was before. See picture below.
 click image to enlarge it
Notes:
A very common mistake is calling a motor with "wasted spark" a 4
stroke motor. Wasted spark means the 4 stroke motor's ignition fires at
TDC compression (like it should) and also at TDC overlap. You should set
this as a 2 stroke motor because if fires on every TDC just like a 2 stroke
motor. Trying to make a wasted spark engine produce good readings by
setting it up as a 4 stroke motor could waste a lot of time.
for more info on dealing with "wasted spark" ignitions.
Another common mistake is you have not set up the software correctly to read
engine RPM. Run the dyno and see if you get dyno RPM. If you start
getting engine RPM once you get dyno RPM, you have the software set up to
calculated engine RPM from dyno RPM in Preferences. Also be sure there is
a Yes in the Used? column in DataMite specs and you have the engine RPM plugged
into the correct connector on your logger.
R1 was reduce in value to about 750 ohms in 2019 for better
sensitivity.
R1 can be in different locations on different generation
boards. Do not go lower than adding a 1K resistor without contacting
Performance Trends. When you are done soldering in the additional 1K
resistor, check with a volt meter that the resistance across R1 is now somewhere
between 400-600 ohms.
Wrapping the purple wire several times will produce a stronger signal, making
this resistor modification unnecessary. You can also tape the purple wire
along the length of the plug wire for 2-4 inches. This also produces a
stronger signal.
Back to Top
I need my brake dyno to
measure torque in both directions of rotation. Can you set up a load cell
to do that?
This is a common question we get, especially from chassis dyno owners who
want to test RWD and FWD vehicles on the same rollers. The FWD cars would
be backed onto the rollers, and thus spin the rollers in the opposite
direction. And, Yes, we can set up a load cell amplifier to measure torque
in both directions, under compression and tension. However, there is a
price to pay for this.
For a normal load cell, say, always in compression, we have a full 0-5 volts
to work with. For example 0-5 volts could be 0 to 1000 lbs. If you
want this load cell to do both compression and tension, then we only have 2.5
volts to work with. For example, 2.5-5 volts could be 0 to 1000 lbs and
2.5-0 volts would then be 0 to -1000 lbs. You would loose half of the
resolution of your torque measurement. You would also have to change the
calibration number(s) in the DataMite program for the torque channel.
Typically this would involve just changing the sign of one of the torque
calibration numbers.
Another option that is easier for most mechanically inclined people to do,
would be to reverse the load cell mounting. When you go to FWD from RWD,
you could just change where the load cell is mounted. This would keep it
always measuring in, say, compression even though the dyno would be spinning and
absorbing torque in the opposite direction. With this option, you do not
need to change the calibration numbers in the program (unless the torque arm
length changes with the second mounting location). You also do not loose
any resolution in your torque measurement.
Recent Development: Also, we have developed an adapter cable which can
reverse some wiring at the load cell amplifier. This way you do not have
to change the load cell mounting. Check with us for some options.
Back to Top
I'm
using the Engine Inertia correction for my water brake dyno. How can I see
how much effect it is having on the results?
When you are doing an accelerating test, some of the engine's power is going
into accelerating the engine's and dyno's rotating inertia, so results will be
lower than during a steady state dyno run, where you set for, say, 2 seconds at
each RPM. The faster the acceleration rate, and/or the more inertia
(larger engine flywheel, heavier the crankshaft, etc), the more the power
loss. During a decelerating test, power is being released from the
spinning inertia, so results will be higher. This is one reason people
like decelerating tests more. It produces higher numbers.
The Pro and Enterprise Editions of the Dyno DataMite let you correct for
these inertia effects. The goal is to produce the same power whether
accelerating or decelerating, whether fast or slow, whether lots of rotating
inertia or not. However, because you must be somewhat careful to keep
track of things to use this feature accurately, we somewhat hide it. This
feature must be turned on in Preferences under the "Calculations
(cont.)" tab. Now you will see a new setting in the Test Options
screen as shown below.
 click image to enlarge
When this is turned On, the settings which effect how much inertia the engine
has is set in the Engine Specs screen, as shown below.
 click image to enlarge
A user who was using the Engine Inertia correction wanted to know how much
effect this was having on his results. So, like with many things you my
want to investigate, you should first make a copy of a test under a new
name. I saved is "10" test under the name "10 no
inertia". Then all I did was set the "Correct for Engine Inertia
Effects" in Test Options screen to No and compare the results, as shown
below. (Note: I had the Preference "Show Comparison Run
Also" set to Yes under the Main Screen tab, so my changed file appeared on
the main screen graph, compared to the original "10" graph. You
would have gotten a similar graph by clicking on the "Graph" dropdown
at the upper left of the main screen and choosing "10" and "10 no
inertia" for graphing.)
 click image to enlarge
You can see from the graph above and columns of numbers down the left side,
this accelerating test gained about 20 HP (402 peak HP down to 382 HP) with
Engine Inertia Correction turned On, or about 5%. This engine accelerated
at about a rate of 280 RPM/sec. If it had accelerated more quickly, like
600 RPM/sec, the effect would have been more than double. The idea would
be that both the 280 and 600 RPM per second test would produce 402 HP with the
Engine Inertia correction turned ON. However, with the Engine Inertia
correction turned OFF, 280 RPM/sec accel would produce 382 HP and a 600 RPM/sec
would produce about 360 HP. Obviously you want results which are
repeatable, independent of the acceleration rate.
 to see some more data where the Engine Inertia correction and our Dyno
Controller produces very repeatable data
to see some more data where the Engine Inertia correction and our Dyno
Controller produces very repeatable data
Back to Top
The torque and
HP will peak at different RPMs depending on if I measure or calculate the engine
RPM on my chassis dyno. Why?
The graph below shows that when the engine RPM was measured with an inductive
pickup on a spark plug wire, the torque and HP peak at a lower RPM than when it
was calculated from the dyno roller RPM on this chassis dyno. When you
calculate engine RPM from dyno roller RPM, the assumption is the ratio between
the engine and dyno RPM remains constant throughout the RPM range, and is the
same as when you calibrate the ratio (called "factor" in the DataMite
program). If this is not constant, then the calculated engine RPM will not
be as accurate as measuring it.
 click image of power curve comparison to enlarge
However, the good news is the torque and HP levels between the 2 runs are
about the same, just that the RPM scale is somewhat changed.
The graph below shows graphing out the engine and dyno RPM vs time
for the test with measured engine RPM, and include "Calculated Gear
Ratio" (the ratio between the 2 RPMs).
 click graph of RPMs and Calculated Gear Ratio vs time to enlarge
You will see the Calculated Gear Ratio varies about 15% during the run
depending on the power level being put out by the engine, the higher the power
the higher the gear ratio. This is likely indicating that there is slip occurring
somewhere in the system during the test, perhaps the clutch or the tire on the
roller, or perhaps tire deformation on the roller. (Obviously if you
disengage the clutch, this ratio will change greatly and be meaningless.)
So, to summarize, it is best to measure the Engine RPM on a chassis dyno if
the Engine RPM signal is clean. If you will calculate Engine RPM from Dyno
Roller RPM, remember that the amount of clutch, converter or tire slip you get
will change, and can change where the RPM where the torque and HP occur.
Back to Top
When running my dyno, the computer will sometimes lock up and I have to restart it. How
can I troubleshoot?
Here are some important things to know when you are trying to troubleshoot a
problem:
1) When troubleshooting, you want to try things which are very easy and
quick to do. You are not necessarily trying to come up with a permanent
fix, just trying to understand what may be creating the problem.
2) To test a change, you do not need to run full power tests to save
fuel and wear on the engine. You can do "dummy" tests
accelerating the engine at half throttle to only 5000 RPM when a normal test
would go to 7500 RPM. You do not have to run the engine at all if that
will test the change you have made. The program will record data with the
engine not running. It just will not show power curves and the software
will want to call the test a "Custom" type of test because it does not
look like a power run.
3) Get used to clicking on the "Troubleshoot" button,
touching the top of the graph on the main screen. It shows the raw data
from the 1 or 2 channels which are most critical to creating power curves,
graphed versus time. Time graphs are much more useful for troubleshooting
problems.
 click image to show Troubleshoot button and graph enlarged
Here's a check list of things to try to understand what the problem could
be. If you try a step and the problem is gone, now we have information for
solving the problem.
1) Check if the problem is present with the engine not running.
Watch the Current Readings screen, perhaps watching the weather or power volts
channels to ensure you have communications. You should see reasonable
readings on those channels and the numbers changing slightly.
2) Repeat item 1, but this time with the engine running, perhaps idling
or a "dummy" test.
3) If the problem is not there when trying steps 1 or 2, it could be
electrical noise from the ignition system or engine vibration producing
intermittent connections in one of the connectors. Full power running
produces more electrical noise and vibration. Try the following:
- Move the computer farther from the engine if within 10
ft of the engine.
- Move sensor wires farther from the ignition system and
possibly disconnect the engine RPM lead from the DataMite.
- Try disconnecting some or all sensors from the
DataMite. If problem is fixed, the problem is that particular sensor or
cable, or noise being picked up by that sensor or cable. If problem is not
fixed with nothing connected to DataMite, problem is with DataMite box (which is
very unlikely) or power to DataMite or USB cable. USB cables longer than
10 ft can produce problems.
4) If problem is still there when trying items 1 or 2, then problem
could be software setting or PC.
- Do you get a "blue screen message" or an error
message which does NOT have "DataMite" in the message? If it is
a Windows error message, problem is most likely with your computer.
- Is it possible some program starts up in the background
when problem occurs, like a virus scan or backup program?
- Try reducing the size of the Current Readings screen from
being maximized. Maximized screen requires a lot more computer resources.
- Click on Options in the Current Readings screen and reduce
the Update Rate to, say, 5 or 2 per second. 10/sec requires a lot more
computer resources.
- In DataMite specs, reduce the sampling rate to perhaps 25
or 10 samples per second. 50/sec requires a lot more computer resources.
- Like stated above, these are not permanent fixes, but just
trying to understand what the problem is.
Once you have tried some of the items above, and you can still not figure out
what the problem is, contact Performance Trends.
Back to Top
Why should I measure
weather conditions when engine testing? Does this produce what they call
Corrected Torque and Corrected HP?
We've got a very thorough Motorsport Blog which describe this issue in great
detail.
for the Motor Sport blog describing weather affects on engine performance and
how to compensate (correct) for them.
Back to Top
My RPM Reading
sometimes reads double of what it should, and sometimes reads correct.
Why?
The first thing to realize is we live in an imperfect world. Every
cylinder firing in the engine is slightly different than the last, and every
ignition pulse is also different. The Inductive Pickup is trying to create
a signal from the electrical noise emitted from the spark plug or coil
wire. It has a sensitivity knob to help adjust it to produce a clean,
accurate reading. However, this electrical noise changes greatly depending
on engine conditions like, load (throttle opening), RPM, A/F, etc. So you
could adjust for a clean signal at idle, but then at full power (WOT, or wide
open throttle) the reading completely change.
When an RPM signal jumps between reading accurately to double or half the
correct RPM, the ignition system typically has a "wasted spark"
system. Wasted spark is when the ignition fires double what is
needed. 4 stroke Briggs type motors typically have wasted spark, meaning
they fire every TDC, like a 2 stroke motor. A 4 cycle motor needs to only
fire every 2nd revolution. The wasted spark is occurring during TDC
overlap. Well the ignition signal produced during overlap is typically
much lower than during the compression stroke. See the figure below.
The circles show when an RPM pulse is read by the system. The top
picture shows how if you adjust the sensitivity knob, you can get the system to
read correctly. The 2nd picture shows what happens with "wasted
spark", where the overlap signal is lower than the compression
signal. Depending on how you set the Engine RPM calibration in DataMite
specs, and how you have the sensitivity set, you can get correct or incorrect
readings. Now, say you have it set to see just the compression pulses at
some particular condition, say lower RPM or lower load. Then at higher RPM
or higher load, both signals increase. All of a sudden you are seeing both
the compression pulses and the overlap pulses. The RPM signal will
immediately double.
Typically we say with a 1 cylinder, "wasted spark" ignition to set
up the Engine RPM calibration in DataMite specs as a 1 cylinder 2 stroke (not 4
stroke). This assumes you will see both compression and overlap
pulses. Then adjust the sensitivity low enough to pick up both compression
and overlap pulses.
Note: Circles shown on each ignition signal pulse show the pulse
that will be passed through the inductive pickup box to the DataMite to be
recorded.
The picture above also goes into some details about what the inductive pickup
does to "clean up" the ignition pulses, by not allowing some of the
"ringing out" of the signal to be measured. If it was measured,
you would get possibly 2 up to 5 pulses for each single firing of the plug, and very
erratic RPM readings.
So you can see there can be lots of reasons for the inductive pickup to read
half or double the correct RPM. But with some understanding of what is
happening, you will be able to adjust the sensitivity knob for the best accuracy
throughout the entire RPM range.
 for
a movie demonstrating this.
for
a movie demonstrating this.
Back to Top
How should I size a
fan for my dyno room?
You need a certain amount of air flow through your dyno room to be sure you
get rid of all the exhaust. This is both for accurate engine testing (air
with exhaust produces less power) and for your safety. You also need to
get rid of the heat generated by the engine, especially the exhaust.
One way to get rid of the exhaust is to run a complete exhaust system and
route it out of the room. However, for most race motors running low
restriction exhaust or open headers, this is not acceptable. A common
method of routing exhaust out of the room is pictured below.
Diagram of typical dyno room
exhaust
Picture of kart motor dyno room exhaust pipe

You can provide suction pump(s) to suck the exhaust and extra room air out of
the room. Or you can force feed the room extra air to force the exhaust
and extra room air out the room exhaust pipe(s).
The engine's air flow requirements are approximately 1.5 CFM for every 1 HP,
so assume 2 CFM per HP. So a 400 HP engine will require fans or blowers
which will produce at least 800 CFM. If you are sizing suction pumps for
the exhaust system shown above, you want to size larger than that so there is
always extra room air being sucked out also. Also, exhaust is hotter than
air so it is more expanded than room air. So a safer assumption would be 3
CFM per HP. And because the engine is generating heat you will want blow
out of the room, you may also want
to size blowers a little bigger than 3 CFM per HP.
Some people worry that a blower may put too much pressure or suction in the
room. If there was much more than 0.1" mercury pressure (1.4"
water), you probably could not either open or close the door. A standard
6'8" x 36" door is 2880 square inches. A pressure of 0.1"
mercury is about .05 psi, which sounds like nothing. But that .05 psi
pressure over 2880 sq inches is 144 lbs on the door. Also, if you have one
of our data loggers with internal weather sensors, and have that mounted in the
room with the engine, any small variation in room pressure is measured and
corrected for by the barometer weather sensor.
So to summarize:
- Provide some method of routing the exhaust out of the
building per the diagram above
- Provide at least 3 CFM air flow for every 1 HP of the
engines you will test.
- Mount your DataMite data logger with internal weather
sensors in the room with the dyno to correct for any very slight change in
air pressure from the ventilation fans.
Back to Top
I have a fuel flow sensor
from a different data logger company, but am reading it with your
DataMite. Why doesn't it read until the flow is quite high?
Most fuel flow sensors have some type of turbine wheel inside and produce an
RPM type of signal. Ours uses a very low drag type of sensor, but others
use a magnetic sensor. The magnet tends to make the turbine wheel
"stick" until the fuel flow is quite high.
To show the difference, we did a test where we put a pulse of air through our
meter and let it coast down. It took over 30 seconds to coast down to a
completely 0 reading as shown by the blue line. We did the same with a
magnetic "Brand X" sensor and you can see it coasted down to near 0 in
about 1 second, the green line. The much higher drag of the magnetic
sensor means it requires a lot more fuel flow to read. It can not read low
fuel flows. Where ours with the much lower drag turbine wheel can read
very small fuel flows. And, ours is about half the cost. Just 2 more
reasons to pick a Performance Trends' DataMite logger.
Back to Top
How does a brake dyno
(water brake or eddy current brake) dyno work?
The word "brake dyno" comes from the fact that in the early 1900s,
the absorber was actually a friction brake, like brakes in your car. They
were very difficult to control and got hot very quickly. A modern brake
dyno puts a load on the engine with something that can absorb power for long
periods of time. These include something like a hydraulic pump, a water
impeller like a water brake, or an electrical brake like an eddy current brake.
The image below explains the basics and how you need some type of load cell
measuring force (lbs) at some distance out from the center of rotation (feet) to
measure the torque (foot lbs) being absorbed by the dyno.
 click image to enlarge it
Back to Top
My torque and HP are low and
both peak at the same RPM. Why?
This typically occurs because you are not at WOT (wide open throttle, full
power) throughout the run. For example, if you are slowly "easing
into the throttle" during the run to avoid tire slippage on a chassis dyno,
your tq and HP will be low until you get to WOT. In the picture below, it
looks like the engine finally got to full throttle right before the end of the
run, when the throttle was closed. Both the torque and HP peak at nearly
the same RPM, which is very unusual. The torque should almost always peak
500-1000 RPM or more before (at a lower RPM than) the HP peak.
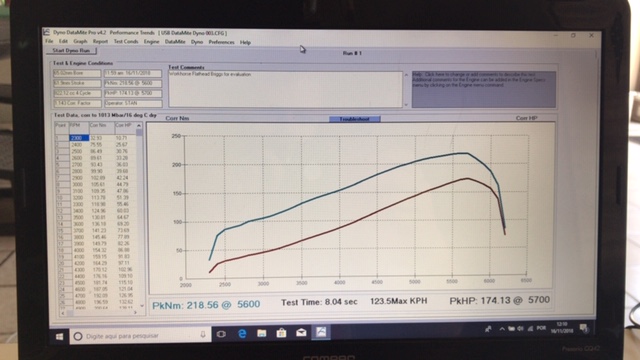
Here's an even more extreme example.
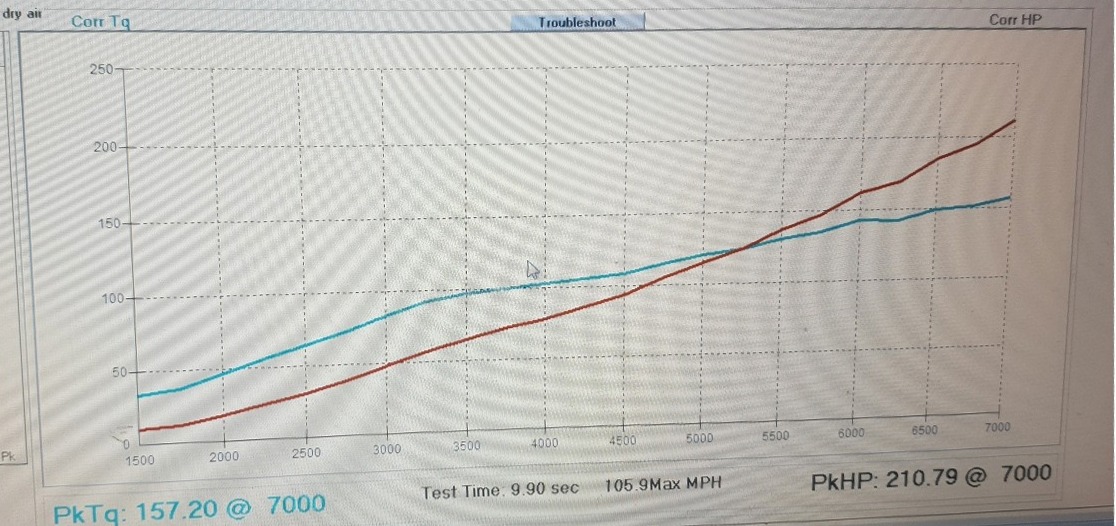
To fix the problem, be sure you are WOT before you start your run. If
you can't do this because of some slippage or other limitation, you must realize
you are not getting full power performance curves.
Back to Top
The air for my motor is different
than the air for the DataMite logger. Will the Weather Corrections still
be accurate?
Three measurements go into Weather Corrections, Barometric Pressure,
Humidity, and Air Temperature. The barometric pressure at the motor and at
the DataMite are exactly the same (unless you have a special "altitude test
cell". The humidity at the motor and at the DataMite are the nearly
the same, unless you have special A/C to change the humidity of the air going to
the engine. Also, the fan in the lid helps ensure that the sensors
inside the box can quickly track any changes in humidity and temperature in the
room. (For accurate measurement of absolute humidity, the air temperature
for where the relative humidity is measured is also required. The DataMite
system is set up to use the air temperature inside the logger for this, as this
is also where the relative humidity is measured.)
However, the temperature can change very quickly and can be significantly
different between the DataMite and the air going into the engine, especially if
that air is coming from a separate duct. For this reason, the DataMite
software lets you assign a thermocouple channel as "Std Thermocouple, Eng
Intake Air". If this channel is assigned, the software uses this
temperature for the correction factor. In this way, the DataMite system
will accurately know all 3 conditions for doing accurate weather corrections.
for the Motor Sport blog describing weather affects on engine performance and
how to compensate (correct) for them.
Back to Top
Is there an
easy way to adjust the inertia of my inertia dyno to get the torque or HP number
I want?
First, figure out how much you want to factor the reported torque or HP up or
down. Say you want 100 HP and dyno is showing 80
HP. The factor will be 100 / 80 = 1.25 or you want 1.25 times more inertia.
Say the Total Inertia in the lower right corner of the dyno specs for the 80 HP run is 121. To increase the HP by 1.25, you will need 121 x 1.25 or 151 inertia. Adjust the inertia wheel width and watch the system's total inertia number until you get 151. Save this and back out of the dyno specs screen and the power will be refigured based on this new total inertia, showing close to 100 HP.
Notes:
For a Chassis Dyno, do not adjust the roller diameter.
This diameter is used to measure the vehicle's speed (MPH or KPH).
Chassis dynos will
always report less power than an engine dyno. Expect chassis dyno numbers
to be less. The current Pro or Enterprise software has a Preference
setting to allow you to enter a "Drivetrain Losses %" so you can
factor up chassis dyno numbers for these losses. This loss is also
reported in the printouts.
If this is an engine
dyno, where 1 flywheel makes up most of the inertia, just multiply the flywheel thickness
(not diameter) by the factor, 1.25 in this case.
For good repeatability,
DO NOT keep adjusting the dyno specs. Once you set them, do not change
them unless you are truly making a change to the dyno.
Back to Top
You say your water brake
controller does not control the RPM sweep rate, but the valve opening
rate. Why?
It is our goal that our Dyno
Controller control the RPM sweep rate, like 300 RPM/second or 600
RPM/second. However, if this is not done perfectly the controller can go
into oscillation. That could easily damage your $50,000 motor and would be
a much bigger problem than not having a perfect sweep rate.
The picture below shows a dyno controller going into oscillation. The
customer had our Dyno DataMite logger system for
recording data but was using another company's controller. It was set to
produce a 350 RPM/second sweep rate, but went into oscillation at the end of the
sweep. You can also see some "blips" at other points during the
acceleration. Luckily the overspeed in the system shut it down and
prevented major damage to the motor.
 click image to enlarge
It can be quite difficult to control an engine dyno, because there is so
little mechanical inertia in the system and the engine can have so much
power. For this reason, chassis dynos are easier to control because the
rollers, wheels and tires, etc add lots of inertia. Inertia makes it so
the RPM can not change so quickly and the controller can keep up. Other
things that make an engine difficult to control and more likely to go into
oscillation are things that produce quick changes in power, like a shot of
nitrous, or turbocharged motors.
For this reason, as of 2019 or water brake engine Dyno
Controllers are just controlling the sweep rate of the water valve's opening
and are much less likely to allow for this oscillation.
Back to Top
How
can I mount Performance Trends sensors on my Land and Sea Dyno?
Performance Trends has retrofitted many different dynos, including Mustang tm,
Clayton tm, SuperFlow tm, DynoJet tm, Stuska tm,
Land and Sea tm, and others. A couple of customers who fitted
our Dyno DataMite to their Land and Sea dynos sent in
some pictures to share with other dyno customers.
Jimmy Brandon from Bland, MO first used our Land and Sea RPM Conversion cable
to keep using the original L&S RPM sensor. However, it produces some
noise spikes and he converted it over to our standard, inexpensive RPM
sensor. Jimmy was quite clever in that he used the existing hole for the
L&S RPM sensor for mounting is fabricated bracket, and plugged the
hole. Jimmy says "I got the new RPM sensor installed today. The RPM reading on the dyno is rock steady now, before it jumped around a little. It even reads the cranking RPM when I am starting the engine, which it bounced all over the place before. I used the existing threaded hole in the water brake where the old sensor installed to attached the bracket, that was the only hard part as it needed a 9/16 fine thread Allen head bolt. If anybody else has a Dynomite 13 inch brake and needs a sensor feel free to show them how I did it."
Comment from Performance Trends: We have slightly better luck with the
magnet mounted on top of the hub with epoxy, not buried flush into the aluminum.
 click images to enlarge
Ryan Freeman of Raptor Racing Engines, Randleman NC devised this method for
mounting both the load cell and RPM sensor on the smaller L&S dynos.
The L&S dynos have special arms designed by L&S with the "load
cell" built into the arm. However, this "load cell" is only
a quarter bridge load cell, which can work. However, the load cells
Performance Trends sells are full bridge load cells, which are typically much
more stable. They don't drift with time, temperature, minor resistance
changes in the connectors, etc. Ryan fitted this L&S arm with our full
bridge load cell as shown in the picture. Its got a ball joint (heim
joint) top and bottom which is good because it avoids any side loading on the
load cell. It also has a rubber damper which reduces torque spikes, and
protecting the load cell from damage. Ryan also mounted the RPM sensor in
his arm. Check out the pictures below.
Comment from Performance Trends: If there is not much torque going
through the arm, things should be fine. However, this is the thinnest part
of the arm and may fatigue in time. You could also mount a bracket to the
bottom of the arm with a couple of small screws, as pointed out in the picture.
 click load cell images to enlarge
 click RPM sensor images to enlarge
Here's how Joe Harkness, Leslie MI josephis34@aol.com
mounted his RPM sensor and load cell. Joe tests chainsaw motors, and his
pics can give you chainsaw guys some good ideas.
 click images to enlarge
Back to Top
Can I keep using my SuperFlow (tm) controller if I use your DataMite for data logging and
analysis?
Both the Performance Trends' DataMite and the SuperFlow controller need a
dyno RPM signal to operate. We are working on sharing the SuperFlow RPM
sensor signal for both systems (June 2021) and may have something in the future
to allow this. However, if you can mount a new DataMite RPM sensor on
anything that spins with the dyno (shaft, coupling, engine, etc), that works
best. Then the SuperFlow controller can keep using the SuperFlow RPM
sensor. The picture below shows how Dave Bisschop in Canada mounted the
DataMite RPM sensor in his bellhousings for DataMite RPM.
 click image to enlarge it
My peak HP (but could
also be peak torque) seems to change a lot and is not repeatable. Why?
This is a common question when people just like to look at peak numbers and
not the full power curve. For example, if you have VERY flat torque or HP
peaks, a very minor change could move the HP peak from, say, 443.4 HP at 5250
RPM to 443.6 HP at 6000 RPM. 0.2 HP could move it 750 RPM. You may
think the tune of the engine has completely changed, but it's just a very flat
HP curve. Flat curves are very typical of restricted motors (engines with
restrictor plates or small carbs to meet race track restrictions).
Looking at just peaks can be even more of a problem with very peak engines,
like 2 stroke engines. Look at the graph below where there are two HP
peaks, one at about 8000 RPM at 24.5 HP and another at about 11,000 RPM at about
25 HP . For most all RPMs the 4 runs agree very closely. However,
one test (the black HP graph) it jumped up some at the 8400 RPM peak so that now
8400 RPM was the peak HP RPM, not 11,000. If you did not look at the
entire curve, you may think that run was totally different (not repeatable).
 click image to enlarge it
Here are some things you can do to avoid thinking tests are not repeatable
when they actual are:
Always compare runs on graphs. Do not just look at peak numbers.
For peaky engines, increase the filtering setting. The graph above was
done with Light filtering, allowing more detail in the graph. However, for
very peak motors, you may want to set the Filtering higher, maybe to
Heavy. You will see now the HP peak for all 4 runs is at 11,000 RPM.
However, the peak HP number is lower due to filtering (smoothing off the high
points and filling in the low points). Because it is slightly lower, most
engine builders do not go for Heavy filtering.
 click image to enlarge it
You can set up your Dyno DataMite program to use a certain amount of
filtering (smoothing) and RPM Increment (100, 200, 250, etc) for doing all
reports and graphs. Choosing a larger RPM increment is also like filtering
in that the data will be more repeatable, but you will not see possible
details. Shown below are the Preference settings you should make.
 click images to enlarge them
Look at average numbers over an RPM range. Another option is to use
Dual Cursors as pointed out in the first picture. If you turn these on,
you can bracket the area you want analyzed as shown below. Then you can
click either the Maximum, Minimum or Average buttons to have that calculated for
the area between the Dual Cursors. (Look up Dual Cursors and all graphing
features in Section 3.3 in the Users Manual for details.) You can see the
Average HP between the cursors for these 4 runs varies from a low of 23.45 to a
high of 23.67, or less than a 1% difference from lowest to highest. Not
bad for an engine this peaky. Note: Reports can also be made with
averages over a certain RPM range.
 click image to enlarge it
Back to Top
How can I check out my DataMite
System without a dyno or engine?
You can make some "dry runs" with your Dyno DataMite system without
an engine, or even a dyno. You will not get any torque or HP curves, but
you can get used to how the system works and record data from some
sensors. With nothing plugged in, you can at least measure and graph and
report power supply voltage, and weather sensors if you have internal weather
sensors.
for a movie describing how to make a "dry run" with no engine or dyno.
Back to Top
How do I get my
DataMite program going on a new computer (transferred over)?
The process outline here is the same for the Road Race and Drag Race DataMite
programs, and very similar for most other Performance Trends programs.
There are several ways to do this. The most universal way is to copy the complete folder from the old computer to a memory stick (zip drive). This is done
without the Dyno DataMite program running. Right click on Start in the lower left corner, then select
Explore (or Windows Explorer, or File Explorer). On the left side of the new screen, look for the C: drive (sometimes called Local Disk C:) and double click it. On the left side, now look for Program Files folder and double click it. (For Win 7 and Win 10 this may be Program Files (x86).)
For Dyno DataMite, look for Performance Trends folder and double click on it.
Look for Dyno DataMite Analyzer v3.7 folder and right click on it and select Copy.
Now find your memory stick or CD drive on the left side of the screen, right click on it and select Paste. You have now copied everything from your old computer to your memory stick or CD. This is an excellent way of making a backup of all you data also.
Now, on the new computer, install the Dyno DataMite program to your new computer to the default location,
the location where it automatically wants to go. You can do this from your
CD, or
to download from our website, and follow all of the default
prompts. (Note: Install the version you own, like 4.1 or 4.2, unless you want to
purchase an updated version, typically $100 to $250). When asked, select to do a
Complete installation.
Now go to your new computer and insert your memory stick or CD. Again, this is done
without the Dyno DataMite program running. A message may come up automatically and you want to "Browse" the memory stick or CD. If not, Right click on Start in the lower left corner, then select Explore. On the left side of the new screen, look for the yellow folder Dyno
DataMite Analyzer v3.7. Right click on it and select Copy.
Now look for the C: drive through the same screen from where you Copied the folder. You may have to go up a few levels. When you find the C: drive (sometimes called Local Disk C:), double click it. On the left side, now look for Program Files folder and double click it. (For Win 7 and Win 10 this may be
the Program Files (x86) folder.)
Look for Performance Trends folder and double click on it.
Right click on Performance Trends folder and select Paste. If you have done this correctly, it should ask you if you want to overwrite some files and say Yes.
(Do not make the common mistake of copying the Dyno DataMite folder from the zip
drive into the Dyno DataMite folder on the C drive.)
Now install the Dyno DataMite program to your new computer to the default location,
the location where it automatically wants to go. You can do this from your
CD, or
to download from our website, and follow all of the default
prompts. (Note: Install the version you own, unless you want to
purchase an updated version, typically $100 to $250). This time, when asked, select to do a
Refresh installation instead of a Complete installation.
Now you should be able to start your new Dyno DataMite installation on the new computer by double clicking on the desktop icon and all your old test files should be there.
Click on File, then Open from All Saved Tests to view them.
Resetting your Master Dyno Specs:
To get your dyno settings and calibrations back, you need to reload the Master Dyno
and Master DataMite Specs. In the DataMite program, open one of your old tests which you know represents how your dyno is configured today, a recent good test. Click on
DataMite at the top of the main screen. Once inside the DataMite Specs screen, click on File (at top) then Save as Master
DataMite Specs. Click on Back to return to the main screen. Click on Dyno at the top of the main screen. Once inside the Dyno Specs screen, click on File (at top) then Save as Master Dyno Specs. Click on Back to return to the main screen. Now you should be ready to start testing again.
Notes:
With newer versions of the software, you can right click on
Open when opening a good, recent file, then select Open as Master. The
program will prompt you to click on OK or Yes about 6 times to walk you through
the process outlined in the paragraph above.
Your program will run for 10 days on this new computer. You will need
to get a new Unlock Code from Performance Trends to run past this 10 day demo
period. At the top, left corner of the Main Screen, click on File, then Unlock
Program Options. Send the Computer Hardware number, Registered Name and
Registered Code #. I need all three to send the correct unlock
number. If you have a CD, send the 4 digit serial number from the CD also.
For our USB DataMite loggers, you will also have to get the USB Drivers
installed to get the logger to communicate on this new computer. Check the
Quick Start paperwork that came with your DataMite for how to install the
drivers from the CD.
for running this USB installer from our website.
for our main Downloads page to install Road Race or Drag Race DataMite software,
or most any of our other programs.
Back to Top
How long are the cables for the
typical Dyno DataMite system?
 click image for typical cable lengths for Dyno DataMite system
Back to Top
Are there instructions that come
with the Dyno DataMite system?
There are extensive instructions that will come with your Dyno DataMite
system. The larger User Manual mostly covers the software and it's many
options. Then we include a "Quick Start" which mostly covers the
exact hardware options you got. Below are links to some examples:
for the Users Manual for the software.
for a typical Quick Start our DataMite III for an inertia engine dyno.
(Depending on your exact options and sensors, your Quick Start could be different.)
for a typical Quick Start our DataMite 4 for a water brake dyno.
(Depending on your exact options and sensors, your Quick Start could be different.)
Back to Top
My updated Dyno
DataMite v4.2 A.062 gives an error message about "data missing".
What does this mean?
In v4.2 A.062 we added an additional check for data integrity for each data
set recorded. If it finds a problem, you will get an error message like
that below.
to read the January 2023 newsletter which discusses what to do about this
message.
How can I make my flow meter
read Gallons per Minute for water?
Most of the time flow meters with the DataMite loggers are used for measuring
fuel flow. These sensors put out a frequency signal like RPM because they
have little turbines inside. Then this flow can be assigned as fuel to or
from the engine, used to calculate total fuel consumed and BSFC. For these
calculations, it is important to know the specific gravity of the fuel so volume
flow like gallons per minute can be converted to lbs per hour, a mass flow of
fuel.
However, sometimes you just want to use a flow meter to measure flow, like
water flow, oil flow, etc. In these cases it is easiest to assign these to
an RPM channel and use the "Other RPM" calibration. This
calibration is not used for any other calculations in the software like clutch
slip, engine RPM, fuel flow, etc. Shown below is the calibration for a
very large flow sensor, with a K factor of 806 pulses/gallon. Smaller flow
meters will have a K factor more in the range of 9,000 to 40,000. Like the
picture shows, the # Magnets should be assigned as 1, and the Multiplier is 1 /
K factor, or .00124 in this case. The Data Name can be whatever you
want. Now this Other RPM channel will read directly in gallons/minute with
the label "gal/min" on graphs and reports. If you want
gallons/hour, multiply the .00124 x 60, or .0744. If the fluid is water,
which weighs 8.33 lbs per gallon, multiply the .00124 x 8.33 for lbs per minute.
NOTE: If the multiplier gets too small for the program to accept
accurately, change the number of magnets to 10, and multiply the multiplier
number by 10.
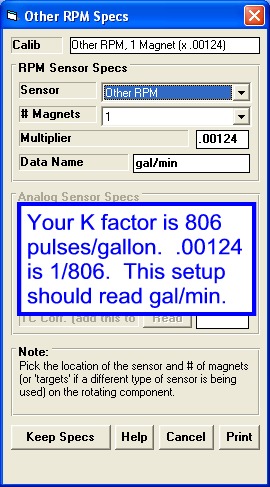
Back to Top
My updated Dyno DataMite software is saying "x.xx seconds of data
missing" from my dyno test. What does this mean?
This message appears when the software senses there is a problem with the
current test you ran, most likely caused by electrical noise. We've always known that electrical
noise from the ignition, certain light fixtures, CNC equipment, parts washers,
battery chargers, VFD motors, etc. can cause noise
in the DataMite data. This shows up as some extreme jumps in data, say for
head temp that reads about 200 degrees to read 0 or maybe 1200 degrees for a
couple of data points. Here's an example of noise on an RPM channel, where
the real RPM is between 800 and 1600 RPM. But there are noise spikes
jumping to over 10,000 RPM.
The DataMite software can typically find these noise spikes after the test and edit
them out, as shown below.
Well, we've just leaned that this "noise" can also cause the DataMite to
not sample at the correct rate. Say the DataMite is set to sample at 50
times a second, that is every 0.02 seconds, or 20 milliseconds. If there
is a lot of electrical noise, the DataMite may sample at every 20 mSec for most
data, but perhaps 21 or 22 mSec at other data points. This is typically
not a big deal, unless you are measuring acceleration rate, like with an inertia
dyno. If the time is not what we expect it to be, acceleration will be
wrong and torque and HP from an inertia dyno will be wrong.
Here's a graph of back to back inertia dyno runs, one with no noise and the
other with noise which shows faster acceleration and therefore more torque and
HP. You will notice the noise effect started at about 5800
RPM.
In Dyno DataMite v4.2 A.062 we have now added a check in the software to see
if the sampling rate is consistent and accurate. If we detect a problem,
we will give you an error message like that below when you first upload a test
to your PC.

This message is very helpful for troubleshooting the source of electrical
noise. For example for troubleshooting the dyno producing the graphs above, we would get
this message uploading a test with the engine not even running. They were also having
trouble with their DataMite 4 not connecting to their PC. It seemed to
connect only half of the time.
We would record about 10 seconds of data, and see if the message above would
pop up, and it did. Then we disconnected most all sensors and recorded 10
seconds of data again, and the message did not appear. Then we plugged
sensors back in 3 or 5 at a time to narrow down the source. It turned out
to be 2 of the EGT probes which were bringing in electrical noise from an
electric pump motor. Their thermocouple extension cable was running close to an
electric conduit.
Before we had this software check, all we knew was that some tests produced
different power when they should be the same, and we did not know which data was
correct. If you own v4.2 software, this is a free update.
The new v4.2B software released July 2023 also checks for this problem,
and can correct the data
so it is like the electrical noise problem was never there. There is a
Preference setting that tells the software how you want this problem to be
handled. However, it is still best to try to eliminate the noise problem
at the source. See below.
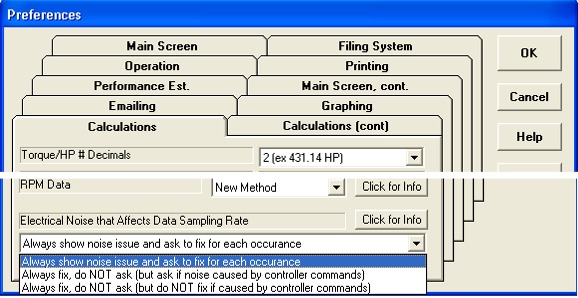
for the text file displayed if you click on the "Click for Info"
button shown in the Preferences screen shown above.
Back to Top
My A/F readings seem too lean,
especially at idle. What could be wrong?
A/F sensors (wide band sensors, O2 sensors, lambda sensors) read the Air to
Fuel ratio based on how much oxygen or O2 they sense in the exhaust. The
less oxygen, the richer the mixture. The amount of oxygen in the exhaust
is VERY low, like less than 0.5% or 1/2 of 1 percent. BUT, if any room air
gets into the exhaust, which is about 20% oxygen, it really makes the exhaust
mixture look lean.
Therefore you must be very careful to avoid any leaks in your exhaust between
the engine and the sensor. Exhaust systems have strong pulses, both
positive and negative and negative pulses can suck small amounts of room air
into the exhaust making it read lean. Also, if you put the sensor too
close to the end of the exhaust pipe, these negative pulses can suck room air to
the sensor from the end of the pipe. This will especially happen at lower
RPM and lower flows, like idle.
Click the image below for more details on mounting your A/F sensor for good
readings.
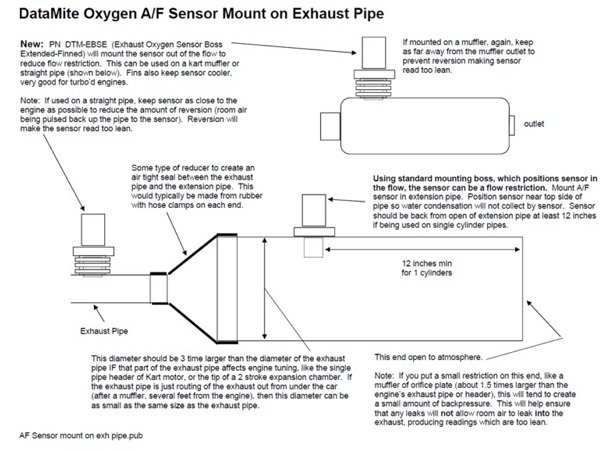 Click image for larger PDF version
Back to Top
How do I
measure ignition timing (spark advance) with my DataMite 4?
Using a special firmware version of the DataMite 4 allows for
Spark Advance to be recorded as the 4th RPM channel. This is done by
measuring spark timing pulses on RPM channel 1 (typically using an inductive
pickup, but possibly a tach signal), and a crank position signal on RPM channel
2. The crank position signal does not have to be at any specific location,
but it is best if it is approximately 10 to 30 degrees After TDC firing.
If setup properly, you can then calibrate the spark advance channel using a
timing light with the engine running. Once calibrated, spark advance in
degrees is displayed on the Current Readings screen, or recorded with your dyno
data.
 for
PDF describing how this feature works
for
PDF describing how this feature works
The graphs below show Engine RPM, OBD2 Spark Advance and Measured Spark
Advance recorded on a 2008 Ford Ranger with standard DataMite magnetic pickup
(BB2-RPML) with 1 magnet on the crank pulley, and inductive pickup with simple
clamp (DTM-IPU) on #1 spark plug. The magnet was epoxied at approximately
12 deg ATDC. You will notice that spark advance changes very quickly
as the throttle is blipped and RPM jumps up. You will also notice that the
Measured Spark Advance matches the OBD2 spark advance very closely, but
when spark advance changes, the Measured Spark Advance changes much more
quickly. This makes sense as the OBD2 readings are only captured every 0.1
second, but the Measured Spark Advance is recorded every 0.02 seconds (50 times
a second).
This needs to be emphasized:
Spark Timing is one of the most critical settings to obtain maximum engine
performance; too little and you loose power, too much and you loose power and
risk detonation, preignition, and engine damage. You may think you can check the timing at, say, 3000 RPM before your dyno test
with a timing light and then assume it is staying constant, or
advancing like it should. But when you can actually measure it, now you
can be sure. Perhaps it looks good at 3000 RPM with your timing light, but
you get to 5000 RPM and it is jumping (called spark scatter) +/- 4 degrees (an 8
degree spread). That is certainly useful information, especially if you
are running into detonation and/or preignition problems.
Measured Spark vs OBD2 Spark with Engine RPM
 click image to enlarge it
Measured Spark vs OBD2 Spark
 click image to enlarge it
Back to Top
Drag Racing and Circle Track/Road Racing DataMite Data Logger Questions
My
MSD Grid (tm) ignition (or most any other high energy ignition) is producing
electrical noise and interfering with the RPM signals. What can I do?
Our DataMite USB IIIs and 4s are very robust for dealing with electrical
noise. However, noise can come in on the RPM sensor wires and produce
false signals, producing incorrect RPM readings.
"Sportsman
Plus"
Drag Race System

Burgess Coleman, a good friend of Performance Trends and racer from Ford with
lots of "hands on" experience with drag racing ignitions, had these suggestions:
Here are some things to try in order of most likely to fix the problem with the least amount of hassle or affect on engine performance.
1) Click on the link below for what MSD suggests to use for suppressing electrical noise from their ignition systems:
https://www.holley.com/products/electrical/parts/8830MSD
2) Install a smaller 1 uF cap in the same way as the large MSD noise suppressing
cap described above. Use a high voltage rating (100 volts or so) cap. Ceramic caps do not have polarity so it is not critical how you install it (which side goes to ground).
3) Run a ground strap from the engine block to one of the MSD box mounting screws.
4) Do not run solid core wires. Use MSD's spiral wound 8 mm wires.
5) Run a shielded 16 AWG wire from the 7AL (or equivalent) to the coil (typically black wire and orange wire). NOTE: This must have insulation which can withstand 600 volts or more. Attach the drain (shield) wire to a good chassis ground on the vehicle or engine block at just 1 end (not both ends).
6) If still problems, consider running resistor or suppressor spark plugs.
My car seems down
on power. How can I check it?
Our Road Race/Circle Track
DataMite and Drag Race DataMite
loggers have options to produce dynamometer quality power curves from doing
acceleration tests in your car. Recently I had a need to see how my 68
Mustang was running, and I did some of these tests with great results.
 click image to enlarge it
 click image to enlarge it
for the Motor Sport blog describing this type of testing and the results.
Back to Top
Can I measure spring
and/or shock loads on my car on the track?
We
often get asked by circle track racers if our DataMite loggers can measure the
shock and spring loads when they are out on the track. They are trying to
better understand their car's
handling. This can
be done with fairly expensive load cell bolts or load cells, which
can be difficult to mount and maintain. Or you can more easily estimate these loads
using shock travel sensors and spring and shock data.
For example, if you
know how much the spring is compressed and know the spring rate you can
calculate the spring force. If you know the shock velocity and have shock
dyno data, you can calculate the shock force. Add the two together and you
have the same data you would get from a load cell mounted on the spring and
shock, or a coil over. Our Shock
Dyno program works with our Road
Race/Circle Track DataMite data logger program to make this process very
easy.
 click to enlarge screen for exporting data from Shock
Dyno program
click to enlarge screen for exporting data from Shock
Dyno program
 click to enlarge screen for importing Shock Dyno data to Road
Race/Circle Track DataMite data logger program
click to enlarge screen for importing Shock Dyno data to Road
Race/Circle Track DataMite data logger program
for a detailed explanation of how this is done. Note, as of Sept 2019 this
is still a limited release option. Contact Performance Trends for more
info.
Back to Top
I
click on the Run Number down the left side of the screen and it does not open
the correct run. What am I doing wrong?
When you get a new run from the memory card, the program asks you for a file
name. If you just let the program default to the name it suggests, you
could overwrite and old test. The programs warn you that you are doing
this, and v4.2 is better at suggesting new file names. However, if you
just click OK or Yes on the messages without reading them, you may be missing
some important info.
 click image to enlarge it
for a detailed answer to this question.
Back to Top
Road Racing Software Questions
I want to optimize my car to produce the
quickest time to accelerate between 2 different MPHs. How can I do this?
Our Drag Racing Analyzer (std, Pro and Pro-Team Engineer) all can do it.
All take the inputs you want to change. Concerning, not starting at 0
speed: the lower level of the program, the more creative you have to be to get
your answer.
For example, with the standard $79.95 DRA, you can specify a shift RPM which
occurs at your desired starting MPH, and another shift RPM which occurs at your
desired ending MPH. (This will take some trial and error and some hand
calculations.) These shift ocurances are reported in the results with
time, feet, MPH, etc. You can subtract and get time between MPHs.
These shift RPMs would change with tire size, gear ratios, etc and would require
a lot of effort on your part.
In the $229 DRA Pro, you can specify a starting MPH and MPH increment for the
results to be reported at. This way you can automatically get your
conditions reported in the output table, but you would still have to do the
manual subtraction to get elapsed time between 2 MPHs.
In the $329 DRA Pro Team Engineer, you can specify conditions for a
"Special Timer", like a starting MPH and ending MPH. Numerous
other "Special Timer" options are possible, like starting MPH and to
400 feet past this point, start of 1-2 shift to start of 2-3 shift, etc.
In Team Engineer, you can also automatically optimize inputs (program tries
numerous different inputs) for minimizing this "Special Timer" time.
This program was designed for exactly what you are doing, but is the most
expensive.
Back to Top
Can I use
my Data Logger data (from your DataMite II or my own data logger) in your
Suspension Analyzer to see what my suspension is doing on the track?
Yes, absolutely! The suspension analyzer can automatically accept data
from our Road Race/Circle Track DataMite software. In addition, it can
read shock travel, steering travel, acceleration, MPH and other channel data
from formatted text files. It can also try to determine the format of data
files itself in an input file format we call "free form", to make it
easy on the user. This has been used with files from several popular data
loggers.
This feature is best explained with a demo movie file available at this
link: DTM-RR Susp Anzr Demo.wmv
Back to Top
Can the Circle
Track/Road Race DataMite analyze my shock's performance with graphs and
histograms?
Yes, absolutely! The Circle Track/Road
Race DataMite software has several graph and report options to analyze shock
travel and velocity. Check out these graphs, which compare lap 4 and 5 of
a particular session. You can also compare (overlay) graphs from different
laps from different sessions.
 (click image to enlarge)
 (click image to enlarge)
Back to Top
In Suspension Analyzer,
why is the Ackerman Error not the same for both tires?
The reason the errors are not exactly the same angle is because there is a "non-linearity" between how much the inside tire must turn vs the outside tire.
To find Ackerman Error, w first find the turn radius you would get from the existing tire angles. Then we find the ideal tire angles to produce this same turn radius. To do this, the inside tire will have to turn more than the outside
tire, so it has a higher error than the outside tire.
Back to Top
In Suspension Analyzer,
what is meant by "binding error"?
For several rear suspension types, when several links are attached to a
solid axle or spindle, the only way for the solid piece to move is if the links
attached to it "stretch" a little. This makes the math fairly
complex, but we try to hide that from the user to make the program user
friendly.
This stretch may be only .001", and in the real world there is enough
clearance or compliance in bushings, rod ends, etc that the suspension acts just
like there was no stretch. Sometimes the stretch can be much more, and
(depending on the compliance in the suspension) make the suspension difficult to
move dynamically (suspension bind). Exactly how much stretch will bind on
your suspension is difficult to know, and is preset in the program.
Obviously production suspensions with rubber bushings can "bind" much
more due to this mathematical "stretching" before it is a
problem.
We report a suspension as having "binding error" when we feel the user
should know binding is possible on some "race" suspensions with very
low compliance. Typically this means you are pushing the dynamic motion
farther than what this suspension can handle, or you could try different
locations for the mounting points to avoid "binding error."
Back to Top
The Spring Motion
Ratios calculated in Suspension Analyzer do not match my hand
calculations. Why?
Motion ratio has to do with the amount of movement of the wheel and tire
compared to the movement of the spring. If the tire moves 1 inch, but the
spring is only compressed .75", the Motion Ratio is .75. This motion
ratio says how much the spring rate is applied to the tire, which is actually
what is important for vehicle handling and tuning.
Wheel Rate = Spring Rate x Motion Ratio 2
So if a spring has a rate of 1000 lbs/in, and the Motion Ratio is 0.5, the
Wheel Rate is only 250 lb/in, much less.
Without detailed computer programs like Suspension
Analyzer, the Motion
Ratio is sometimes estimated as:
Motion Ratio = A / B
from the drawing above. Additional correction can be applied dealing
with the angle of the spring, or involve the C and D dimensions from the drawing
above. However, all of these are making simplifying assumptions to keep
the math easy. Note that both only use the lower arm dimensions, and not
the effect of the upper arm.
"Behind the scenes" in the Suspension
Analyzer, we are actually
moving the vehicle 1" in dive and watching to see how much the spring
actually moves. This is done each time you make a data entry or change a
setting. This is very complex to accomplish, but is the only way to obtain
the true Motion Ratio.
The Suspension Analyzer screen below shows a fairly typical suspension
layout. You will note we put the vehicle through 1" of dive and the
Left Spring (in red) compresses .65 inches, and shows a Motion Ratio of
.65. In this layout, with the upper arm angled down in the normal fashion,
the tire will actually tip up as the spring is compressed, rotating about the
left (red) instant center. This lets the right ball joint drop down
slightly in this condition and contributes to the Motion Ratio determination.

In this screen below, we've moved the upper arm frame mount up about
7". This is not typical, but it really illustrates what the effect of
the upper arm angle. Now the tire actually tips DOWN when the vehicle goes
through 1" of dive. The ball joint actually moves up instead of
down. The spring is now compressed .98" in this condition, which
produces a Motion Ratio of .98.
Motion Ratios for the Shocks and Roll Bar are calculated the same
way. Accurate Motion Ratios are needed to determine Wheel Rates, which are
critical to determining Handling Ratings, Natural Frequencies, and many more
tuning parameters calculated in the Suspension Analyzer.
Back to Top
My Suspension
is not exactly one of the choices available in the Suspension Analyzer.
How can I simulate it?
There are numerous variations in suspension types chassis builders have
developed that do not exactly match the types available in the Suspension
Analyzer. Many times with some small adjustments, these
"special" suspensions can still be accurately simulated by the
program. Here are some examples:
Senneker Performance "Bird Cage": This modification
to a standard 3 link rear suspension involves using a bearing on the rear axle
tube, so it can float like a "bird cage" rear suspension.
However, instead of 2 links on each bearing (like a 4 link suspension), there is
only 1 which acts like a trailing arm suspension. Here's a link to a
picture: https://www.sennekerperformance.com/product/senneker-performance-bird-cage/
This can be simulate as shown in the picture below, by specifying the link
mounting point on the axle as the center of the axle shaft inside the axle
tube.
Active 3 Link with Center Pull Trailing Arm: This modification
to a standard 3 link rear suspension just puts the 3 link mounting hole directly
in front (or sometimes behind) of the axle tube. It could be confused with
the Senneker which has the bearing. Here's a link to a
picture: https://www.portcityracecars.com/CENTER-PULL-TRAILING-ARM-BRKT.html
This can be simulate as shown in the picture below, by specifying the link
mounting point on the axle as the center of the Heim joint mounted on
the axle tube.
Replica GT40 Rear Suspension: As with many independent rear
suspensions, this can be simulated with a 5 Link.
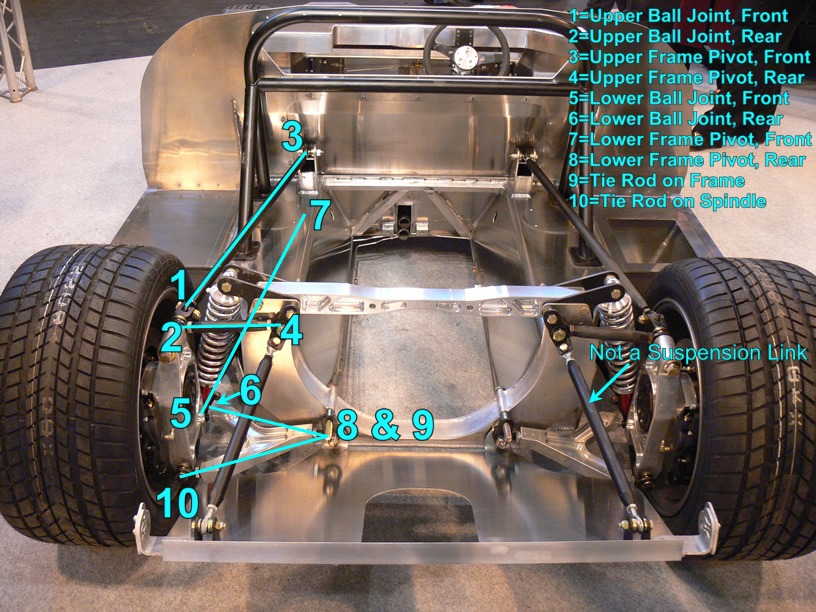
Troyer torsion bar dirt modified rear
end: The Suspension Analyzer does not have an option for torsion bars
on the rear. However, most torsion bars can be approximated by a coil
spring (not "coil over" because the shock absorber is separate from
the torsion bar). First, use the Spring Rate calculator utility to
determine the spring rate of your torsion bars, as shown below. Click on
the "Input (clc)" label to be presented with the Spring Rate
Calculator. Then choose one of the Torsion Bar options to calculate the
spring rate.
Then locate the coil spring on the rear axle where the torsion bar
"lever arm" touches or attaches to the axle. Locate the frame
attachment point directly above that point on the frame. See pictures
below:
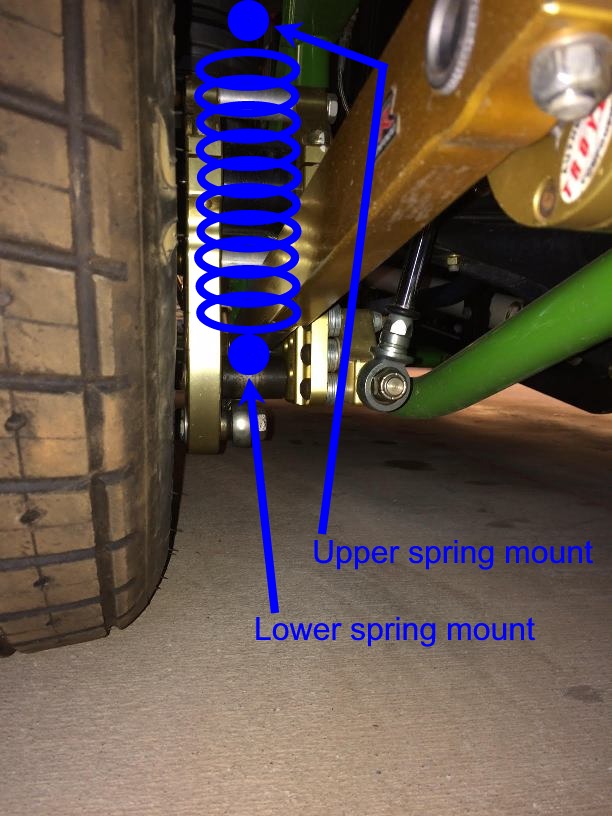
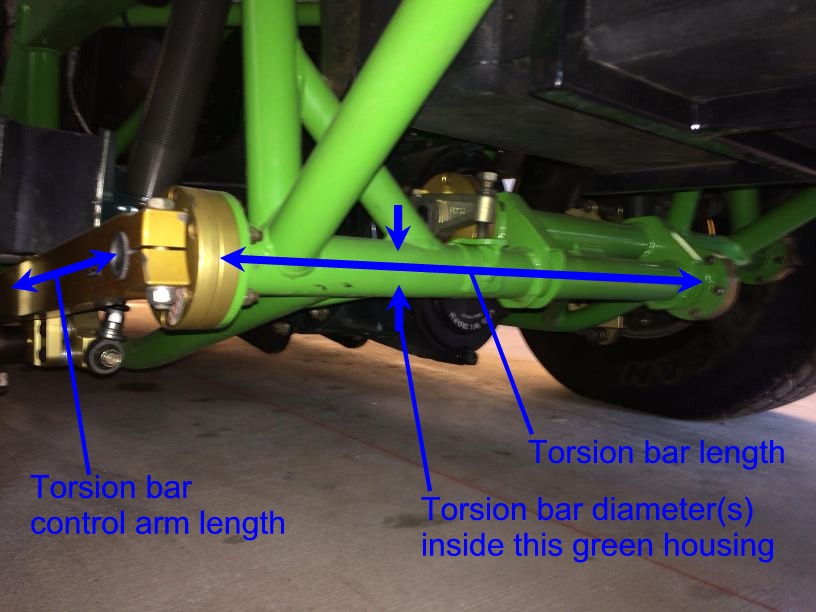
Polaris Razor Rear Suspension: The razor uses one control arm
which goes forward to attach to the frame, and 2 camber control rods. See
picture below.
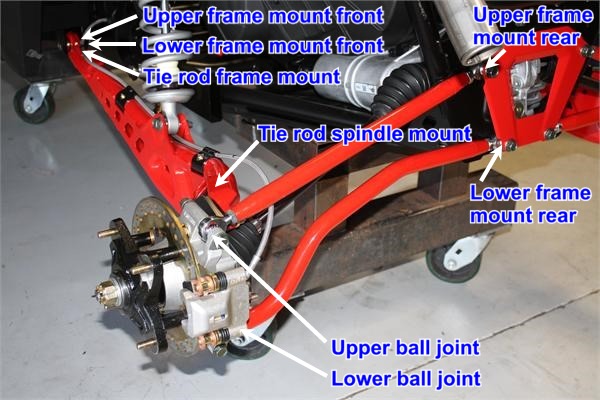
This can be simulated by a Double A Arm suspension where the camber rod ball
joints on the spindle can be the ball joints, the rear frame mounts are the
attachments at the center of the frame, and the front frame mounts of the A Arms
are both at the control arm attachment point at the frame. The tie rod
should attach to the frame at this same point. The tie rod on the spindle
will be a point you make up, typically a few inches ahead of the ball joints and
a few inches closer to the center of the car than the ball joints. It's
exact location on the spindle is not critical.
Chevy Equinox Rear Suspension: This is a pretty common type of
rear suspension, somewhat similar to the Razor above except it has a separate
tie rod to control toe. See
picture below.
 click image to enlarge it
(this list will grow with time)
Back to Top
Shock Dyno Questions
Can you explain what the different Shock Dyno Graphs mean?
The Basic Shock Dyno software does only 1 type of graph, force vs
(absolute) velocity, which most people are familiar with. The Plus version
does many more types.
 click image to enlarge
for a PDF explaining these graphs.
Back to Top
My shocks are rated
at a 6 compression and 3 rebound. What does that mean?
Different shock absorber manufacturers have different number ratings. A 6
from one manufacturer can be VERY different than a 6 from another. The
late Doug Gore wrote a short article on this which is in the attached PDF.
Below is a shock dyno graph of 5 different manufacturer's
shocks, all rated at 6
compression and 3 rebound.
 click image to enlarge
for a PDF of Doug Gore's article.
Back to Top
Do you have any technical
info on reading the Shock Dyno results and adjusting the Shocks?
Ohlins has published lots of good, technical info on interpreting the
results from your shock dyno, and suggesting how to make shock adjustments.
for one of there user manuals with this excellent info.
Back to Top
I only have the basic version
of the software. What's the most accurate way to eliminate the gas force
from the data?
When the shock stops at the top and bottom of it's travel, it is at 0
velocity, but there can also be a very large change in force. This is
especially true of shocks with high forces, and makes it more difficult for the
software to find the exact force at 0 velocity, which is typically the gas force
in the shock.
If you have the Plus software, there are methods to manually measure this
force. If you only have the Basic version, this is an option:
Zero out the load cell in the recording screen before you install your shock.
Install the shock. Do NOT start the dyno, just watch the recording screen and
manually move the shock up and down some to reduce the seal drag, or "sticktion".
Note the amount of force on the shock, which should be gas force. Then re-zero the
load cell to eliminate the gas force
offset before you run your test. Now you have eliminated the gas force
from the data. You may also want to record the gas force, and any other info you think is important in the
Comments section.
Back to Top
My "Football"
graph (sometimes called a "potato" graph) has "bumps" in
it. What does this mean?
The Plus version of the software lets you graph force vs stroke to make a
circular graph as the shock goes through it's cycle. This is often called
a "football" graph or "potato" graph. It is the raw
data and is very useful for troubleshooting data. Shown below is a force
vs stroke graph with 2 bumps at the maximum and minimum stroke, or the top and
bottom of the stroke. This is typically indicating there is some
"slop" or clearance in the dyno or shock.
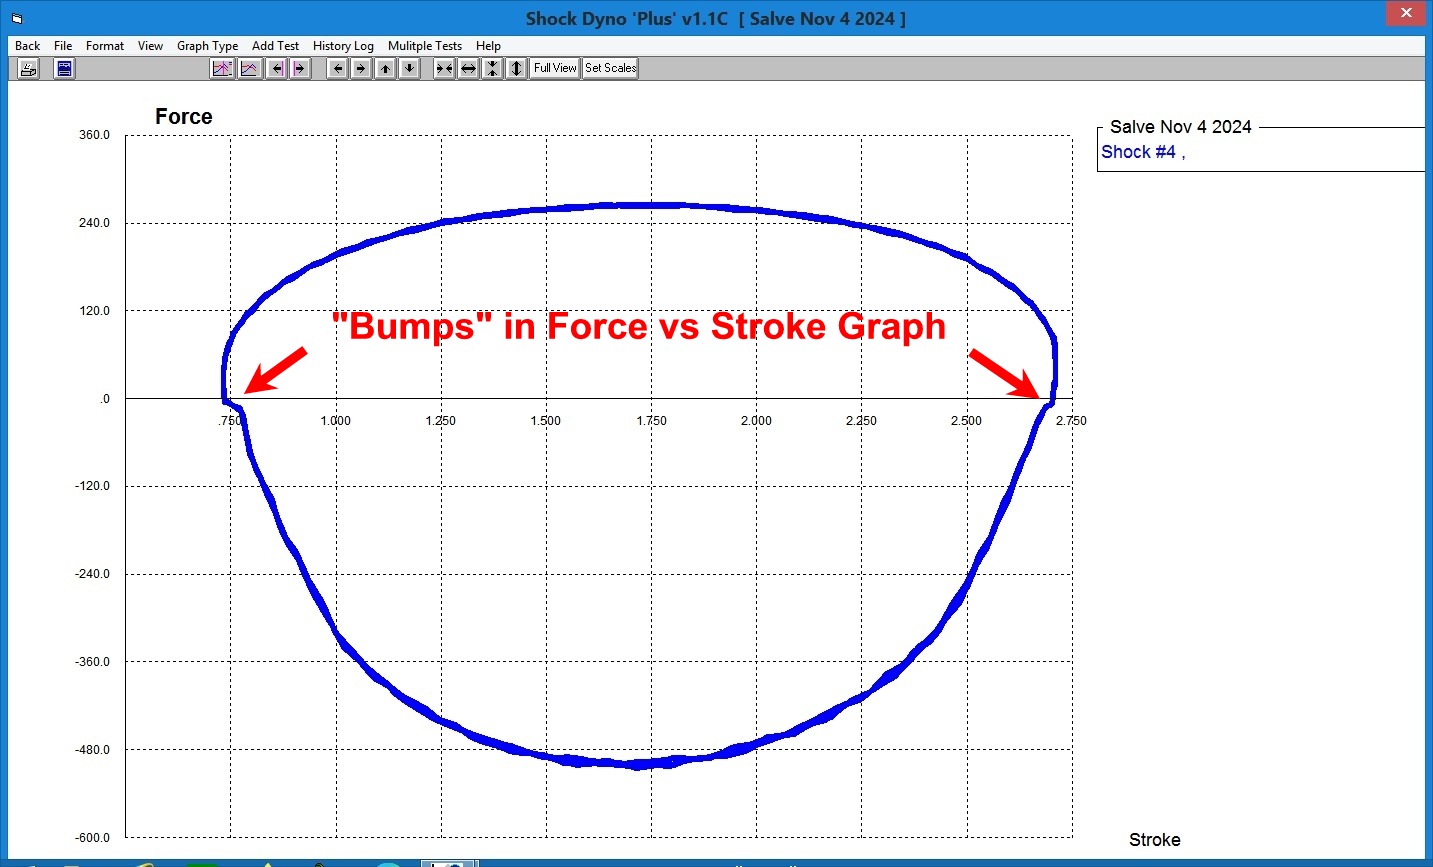
Shown below is a mounting clevis that has not been tightened up, as indicated
by the space between the stud and the shock. Turn the clevis to tighten
this up to fix the problem.
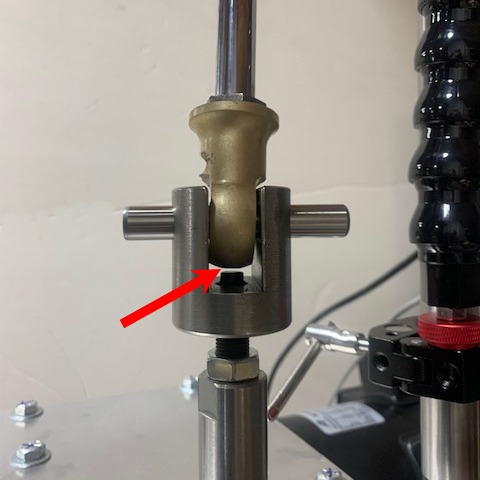
Shown below is the Scotch Yoke mechanism which cycles the shock. Check
for clearance between the drive bearing and the wear plate as shown by "A",
both top and bottom. It is recommended to have about .001" to
.002" total clearance. If you have much more than that, you may want
to remove one of the wear plates by removing the 2 mounting screws as shown by "B".
Then insert a piece of shim stock to make up for the clearance as shown by "C".
The shim can go under either to top of bottom wear plate, but is typically
easier to go under the bottom plate. Replace the mounting screws and
securely tighten. It is important for the shim to extend the entire width
and thickness of the wear plate to ensure it stays in place. Make holes or
slots for the mounting screws. IMPORTANT: DO NOT disassemble the
Scotch Yoke, as you have to be careful reassembling to keep certain alignments.
It is better to have extra clearance than disassembling the Scotch Yoke and
getting the fit too tight.
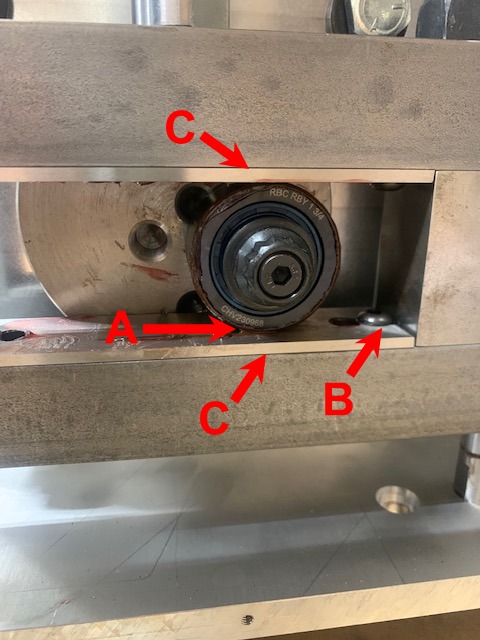
Back to Top
My dyno motor won't
start. How can I troubleshoot the wiring?
Here are some things to check:
Be sure you have turned on the Preference (click on Settings, then
Preferences) under the "Operation, cont." tab called "Shock Dyno
Controls Motor" to "Yes".
Go into the Record (F5) screen and make sure you have communications with the
dyno. Then press the F7 key while holding down the Shift key. The
program should ask if your hands are clear. If you get no message after
pressing F7 while holding the Shift key, your keyboard probably needs you to
press another key while pressing F7 to get the F7 to work correctly. Check
this out.
Make sure you have 110 or 220 VAC power cord plugged in. You should see
both green lights at the front of the dyno lit.
The signal to the motor power relay starts at the 8 pin connector on the
control board and goes through the push button switch at the front of the dyno,
and then through the magnetic door switch, and then through the power
relay. To check that these switches are working correctly, unplug the 8
pin connector. Check continuity (ohms of resistance) between the 2 metal
terminals in the 8 pin connector. You should see about 140 ohms. If
you see no continuity, one of the switches has not been activated or has
failed. See picture below.
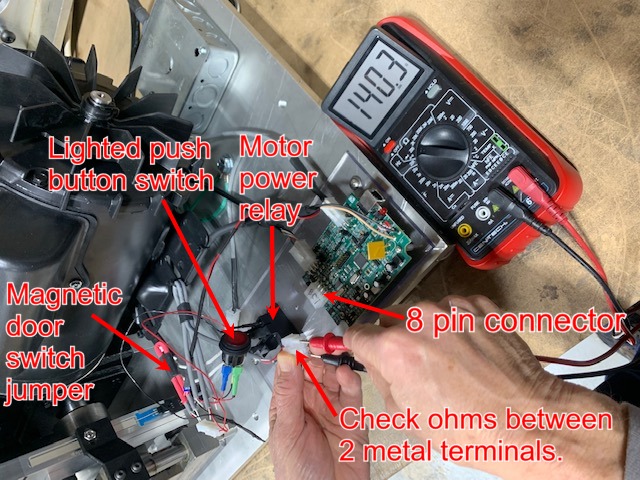
This picture was taken during assembly here at the factory to show components
better. The magnetic door switch was replaced by a jumper wire.
Back to Top
Question
s on Other
Tools
How much blowby should my engine produce
and how much is "too much"?
This can vary greatly for different engine types and
applications.
for a table to help you make this estimate.
Back to Top
My blowby measurement
changes from test to test. Why?
It is critical that all paths for blowby out of the crankcase be blocked off
except for the path to the blowby sensor. This includes the PCV valve on
street motors, which must be removed and plugged. Any leaks are a source
for variability.
Keep the blowby sensor at the exact same orientation for all testing.
Tipping the sensor up or down at a different angle can produce variability.
Rezero the sensor with the motor not running and with no possible air flow
through the sensor. You may want to plug the outlet hose when rezeroing.
The blowby sensor measures flow out of the crankcase. The assumption is
this flow is from gases passing by the rings. However, it could be vapors
boiling off from new oil, called the "lighter ends". These are
the parts of motor oil (a mixture of various hydrocarbons) with a higher vapor
pressure. There could also be water vapor in the oil from
condensation. Dyno tests which take only 5-10 seconds make this type of
error difficult to protect against, compared to a test taking 10-20 minutes of
warm up and stabilizing at every, say, 200 RPM. If you see the blowby
coming down from test to test and you don't think it is the rings seating in, it
could be from these vapors boiling off and registering as extra blowby flow.
Back to Top
Can the Quick Cam
Checker create a cam file to be read by Engine Analyzer Pro or other Performance
Trends software?
Version 4.3 of our Cam Analyzer (release at the end of 2018) lets you
import files from the Performance Trends Quick Cam Checker. You need v1.1 A.015
or later of the Quick
Cam Checker, which is a free download NOTE: The precision of Quick Cam
Checker files is not as good as those measured with the Cam Analyzer on our Cam
Test Stand.
Without v4.3 of Cam Analyzer you could do the following: Files saved by the Quick Cam Checker are
mostly for troubleshooting the data being recorded. They are not saved in
a format which can be used by other Performance Trends programs (except Cam
Analyzer v4.3). However,
you can record data to get Duration at .050", Centerlines and Max
Lift. Then you can change the Rated Height to .200" and run the test
again to get the Duration at .200". Now you have enough info to
calculate a Ramp Rating in one of our Engine Analyzer programs, Plus, Pro and
Enterprise. Letting one of these programs calculate a profile from these
inputs will produce a cam profile very close to the one measured by the Quick
Cam Checker.
(Note: The vA.012 introduced in March 2017 lets you produce a report
of a test if you upload the results to the PC before recording more tests.
Then you can make a report which will give you duration at both .050" and
.200" lift. This lets you avoid having to run 2 tests.
for more info on this feature.)
Shown below is the Cam/Valve Train screen from the Engine Analyzer
Plus. To create a cam profile from measurements from the Quick Cam
Checker, first choose one of the "Spec" choices for "Lifter
(profile) Type". This will make visible the Ramp Rating input.
Also choose ".050 inches" for the Lift for Rating Events and enter the
Centerline, Duration @ .050 and Max Lobe Lift from the Quick Cam Checker.
Now click on the "Clc" button by Ramp Rating to open up the "Calc
Ramp Rating, %" screen shown on the right.
In this new screen, set "Based on" to "Duration at .050 and
.200". The previous data listed is already entered in this screen, as
it is carried over from the Cam/Valve Train screen. You can change it here
if you want. Now enter the Duration @ .200" and the program shows the
Calc Ramp Rating for this combination of results from the Quick Cam
Checker. In the screen below, it shows a Calc Ramp Rating of 67.0%. Click
on the Use Calc Value at the lower left and 67% is copied back to the Cam/Valve
Train screen. You have now created a cam profile which is very close to
that measured with the Quick Cam Checker.
Back to Top
Can the
Quick Cam Checker check a cam on the stand by barring over by hand?
The Quick Cam Checker
is typically used when you turn the motor over with a starter. This gives
a fairly consistent rotation speed, which is needed for good accuracy.
However, with some different sensors and slightly different procedure, the Quick
Cam Checker can be used on an engine stand to measure a cam.
First, you need a special 10 turn rotary sensor, and likely the larger
diameter drive wheel. You will also need the head to be off so you can put
a 3rd cam lift sensor above the piston to find TDC. A pressure sensor does
not work accurately when barring the engine over by hand.
for info on the process, links to a youtube movie, and parts you may want to
purchase.
Back to Top
What is meant by
"aspect ratio" in the Spring Wiz program?
Valve spring wire typically has a circular or round cross section, which is
much cheaper to produce. However, if you want a lower spring bind height,
springs can be produced from wire which has an ovate (oval) cross section.
Typical round wire springs have an aspect ratio of 1. However, ovate wire
has an aspect ratio greater than 1, as shown in the picture below. For
example, if the thickness of the spring wire is .140 and the width is .180, the
aspect ratio would be .180 / .140 = 1.29.
 click image to enlarge
Back to Top
sitemap
 (click picture to enlarge)
 (click picture to enlarge)
 (click image to enlarge it)
 (click image to enlarge it)
 (click image to enlarge it)
 click image to enlarge it
  click image to enlarge it
 click image to enlarge it
 click image to enlarge it
 click image to enlarge it
 click on picture to enlarge it
 click image to enlarge
 (click image to enlarge it)
 (click image to enlarge it)
 click image to enlarge it
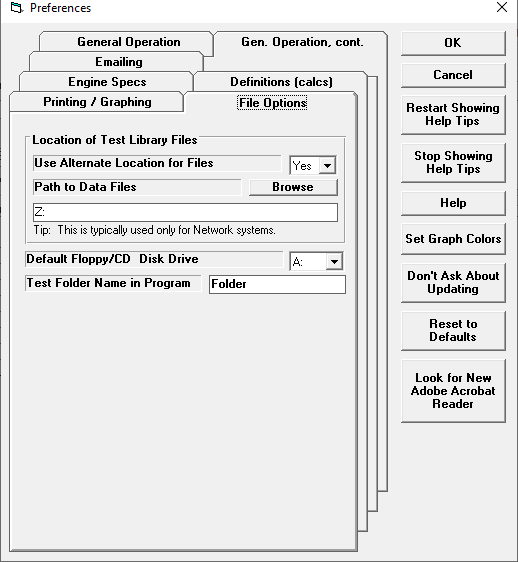
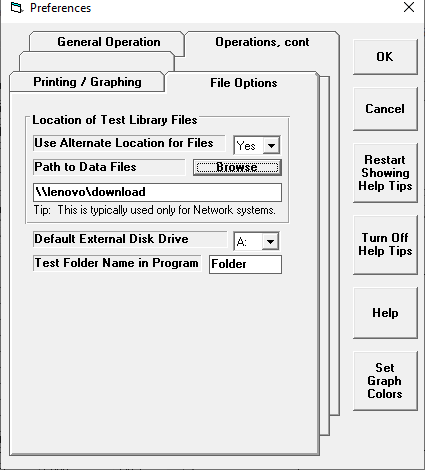
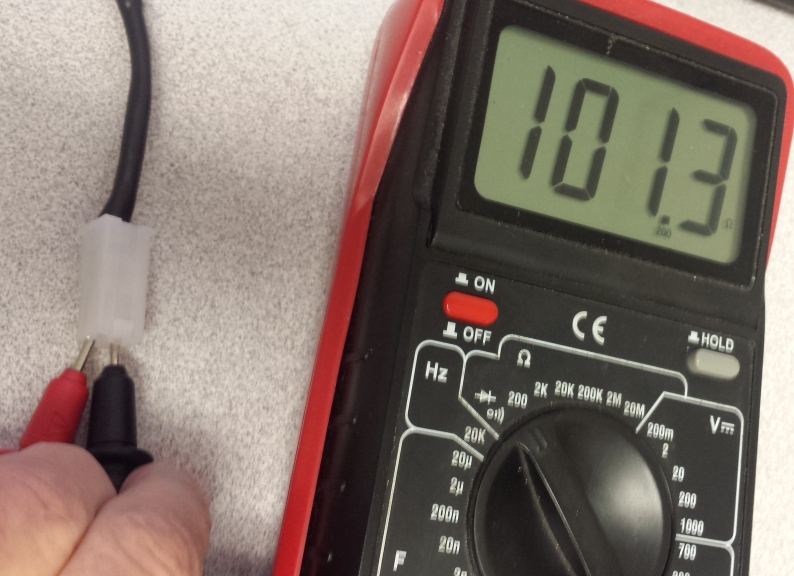
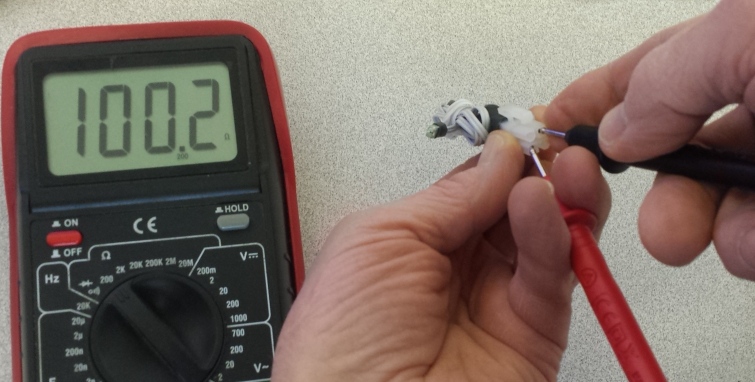
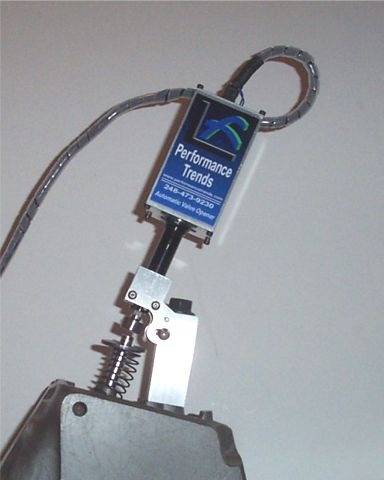
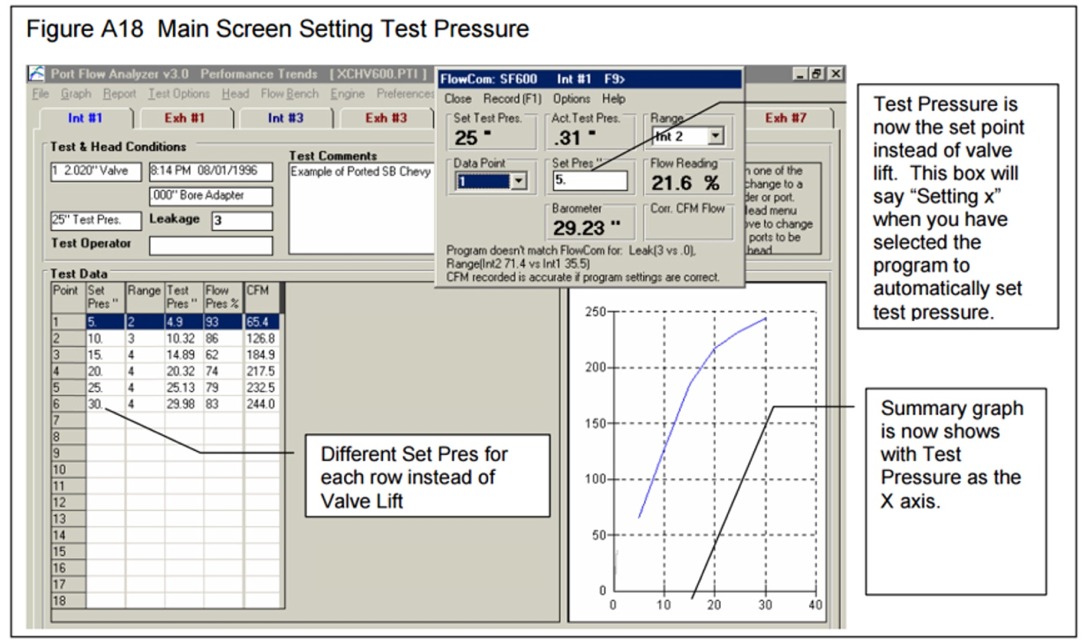


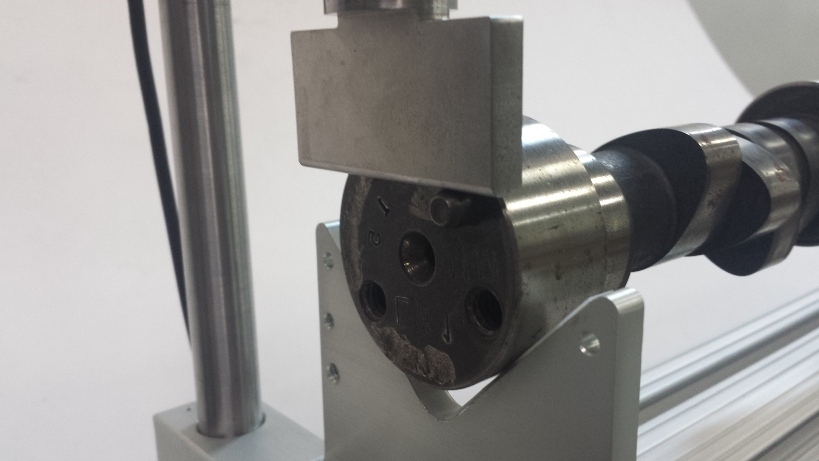


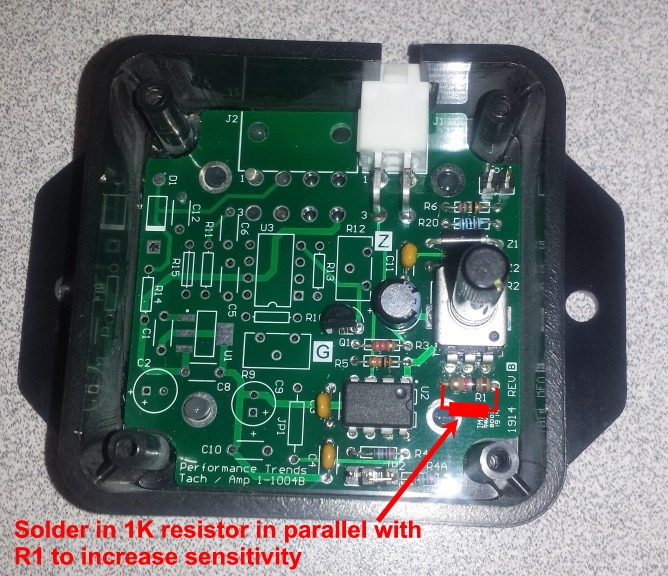
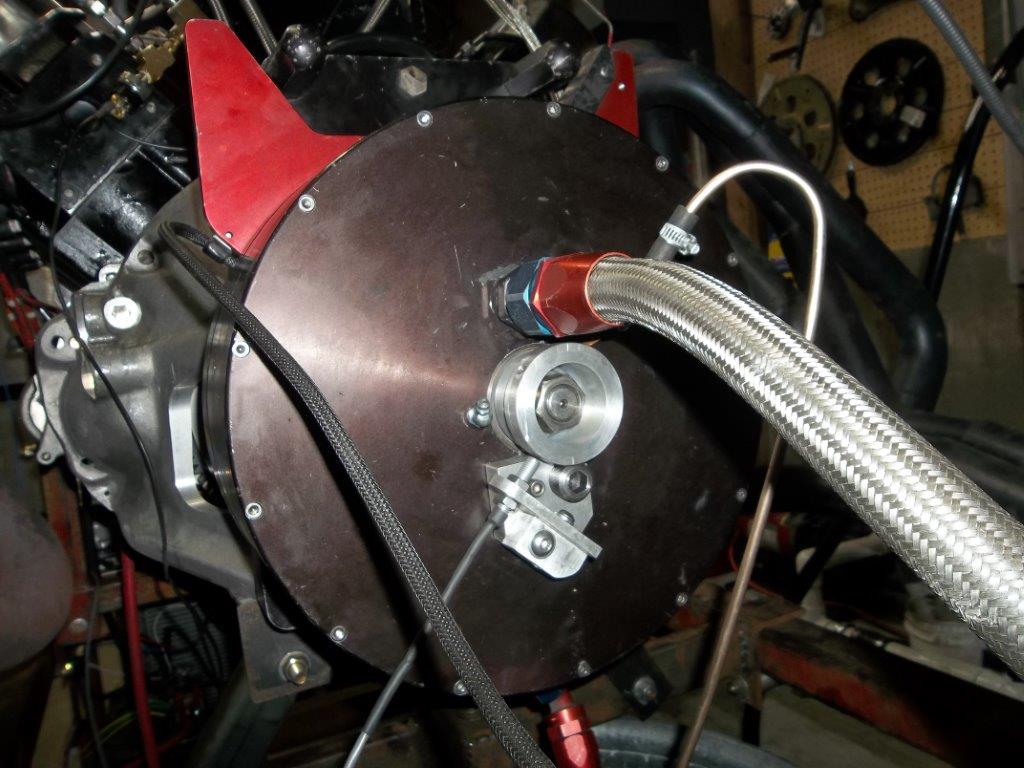
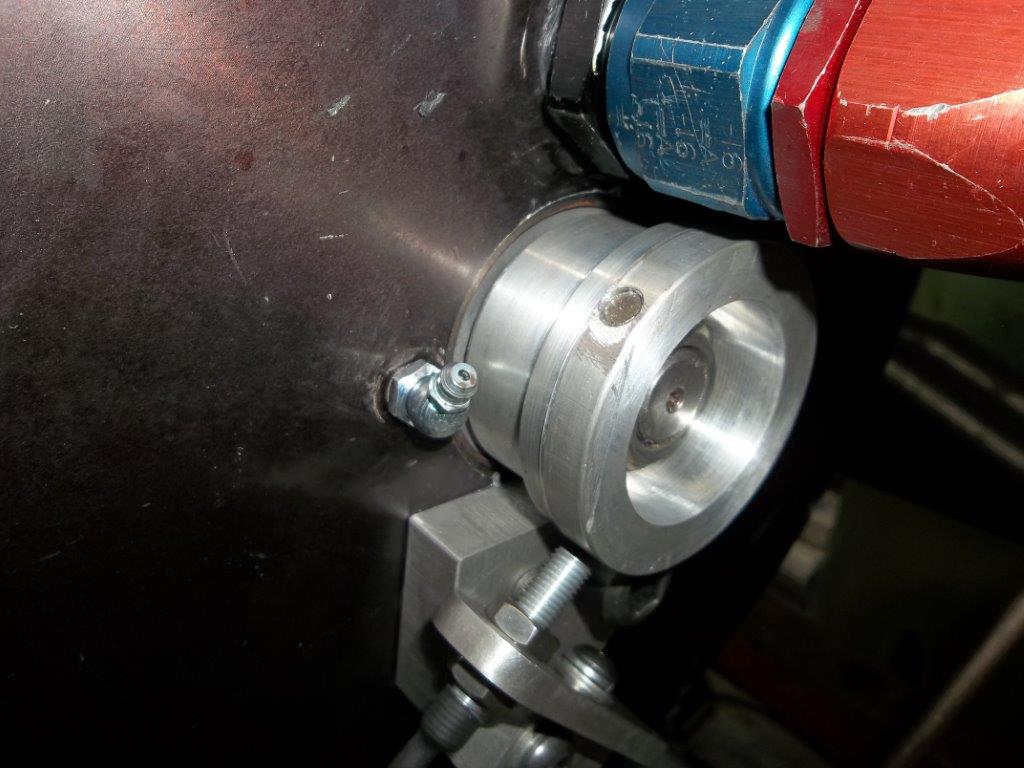
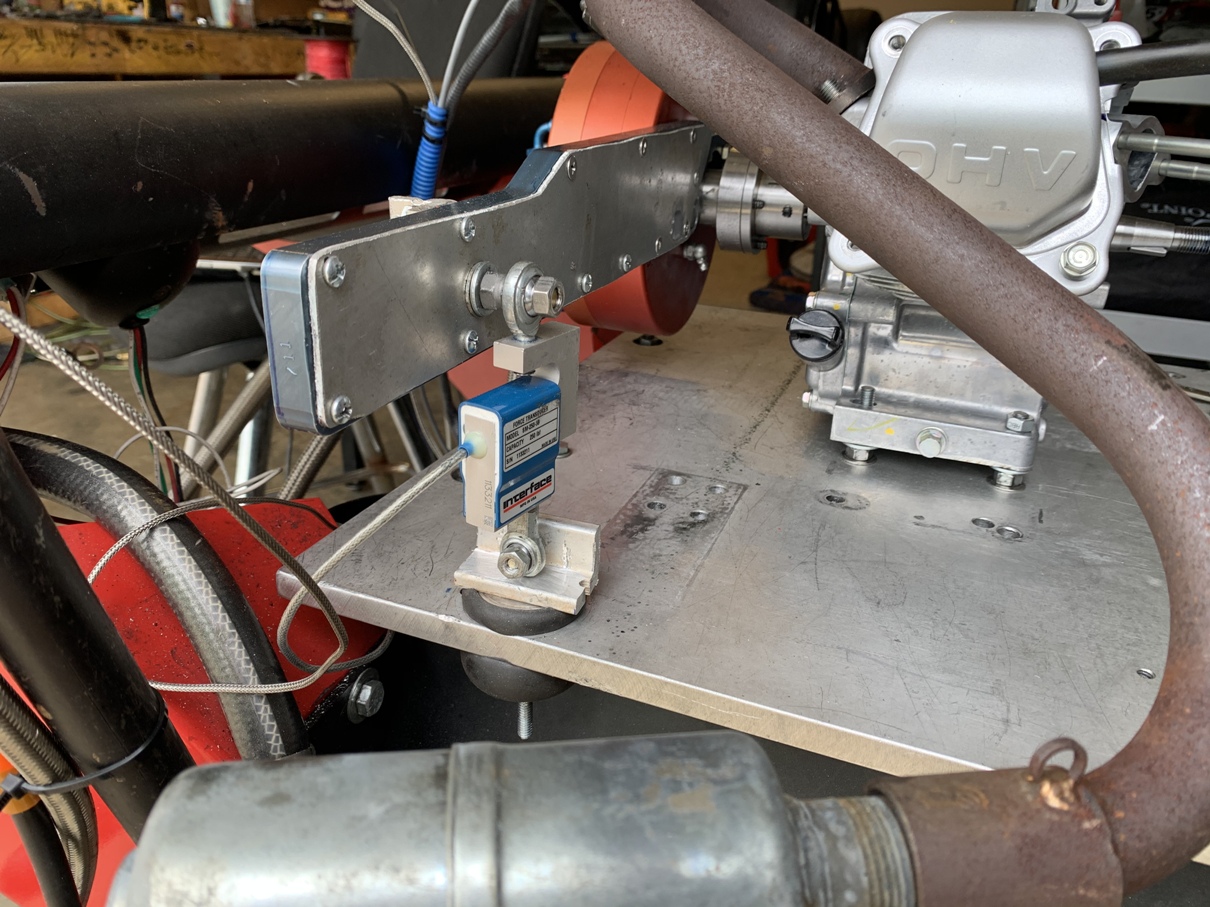
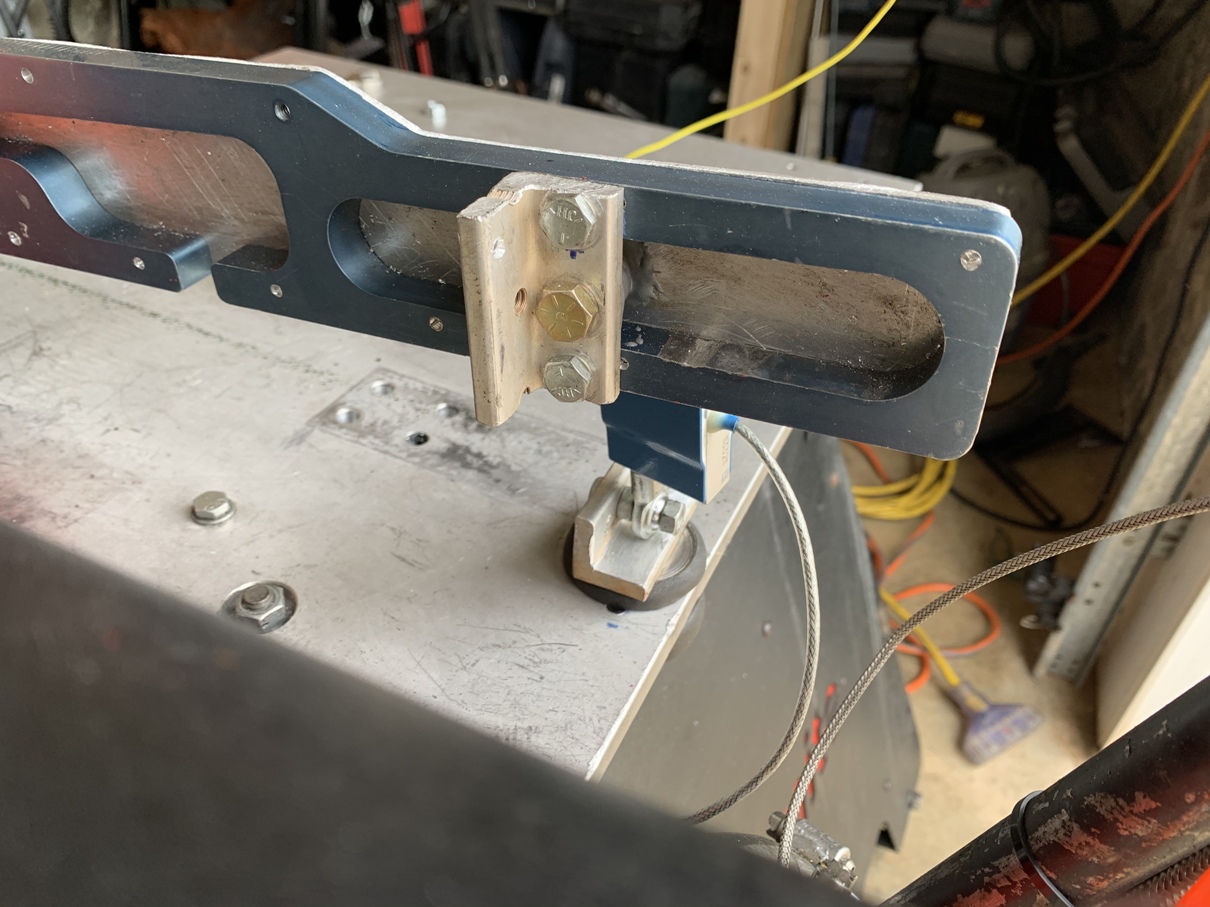
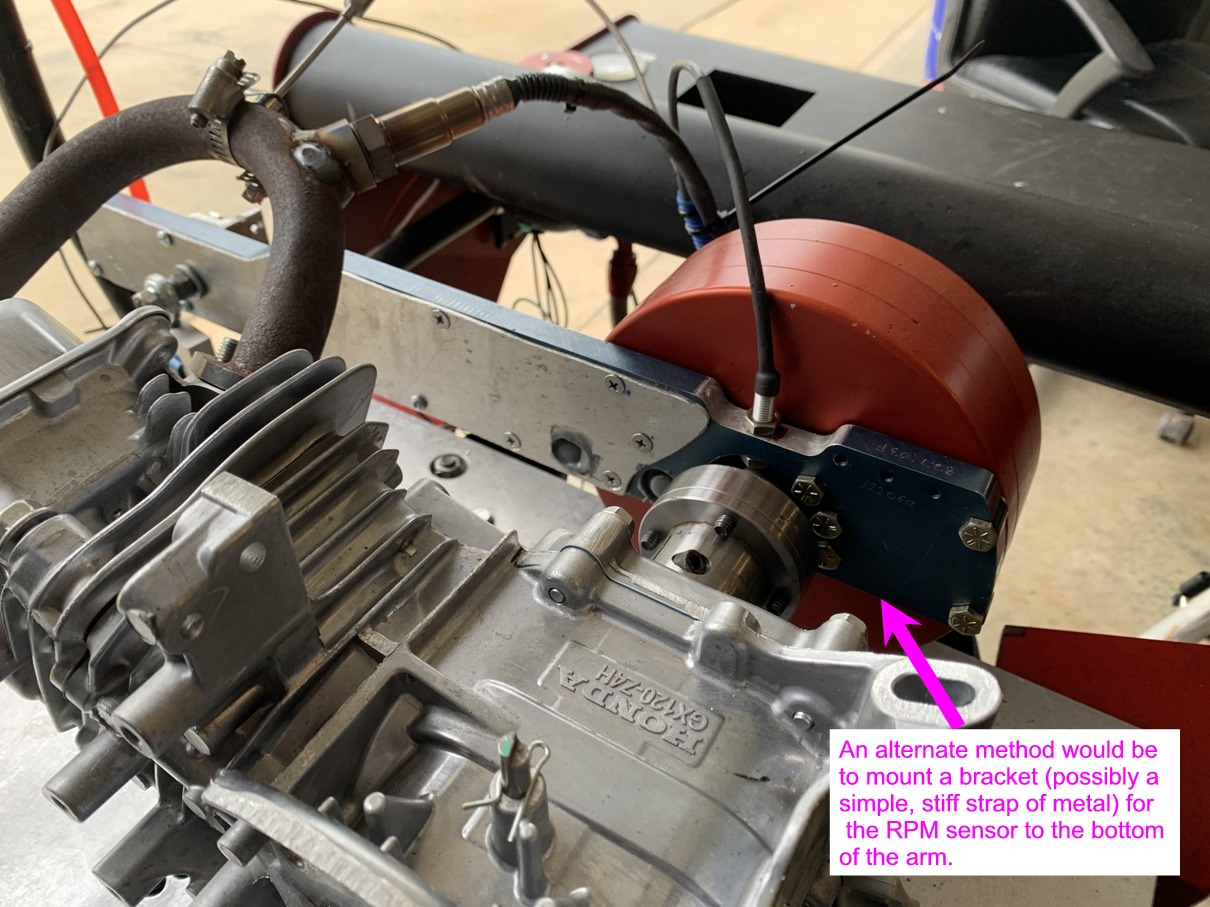
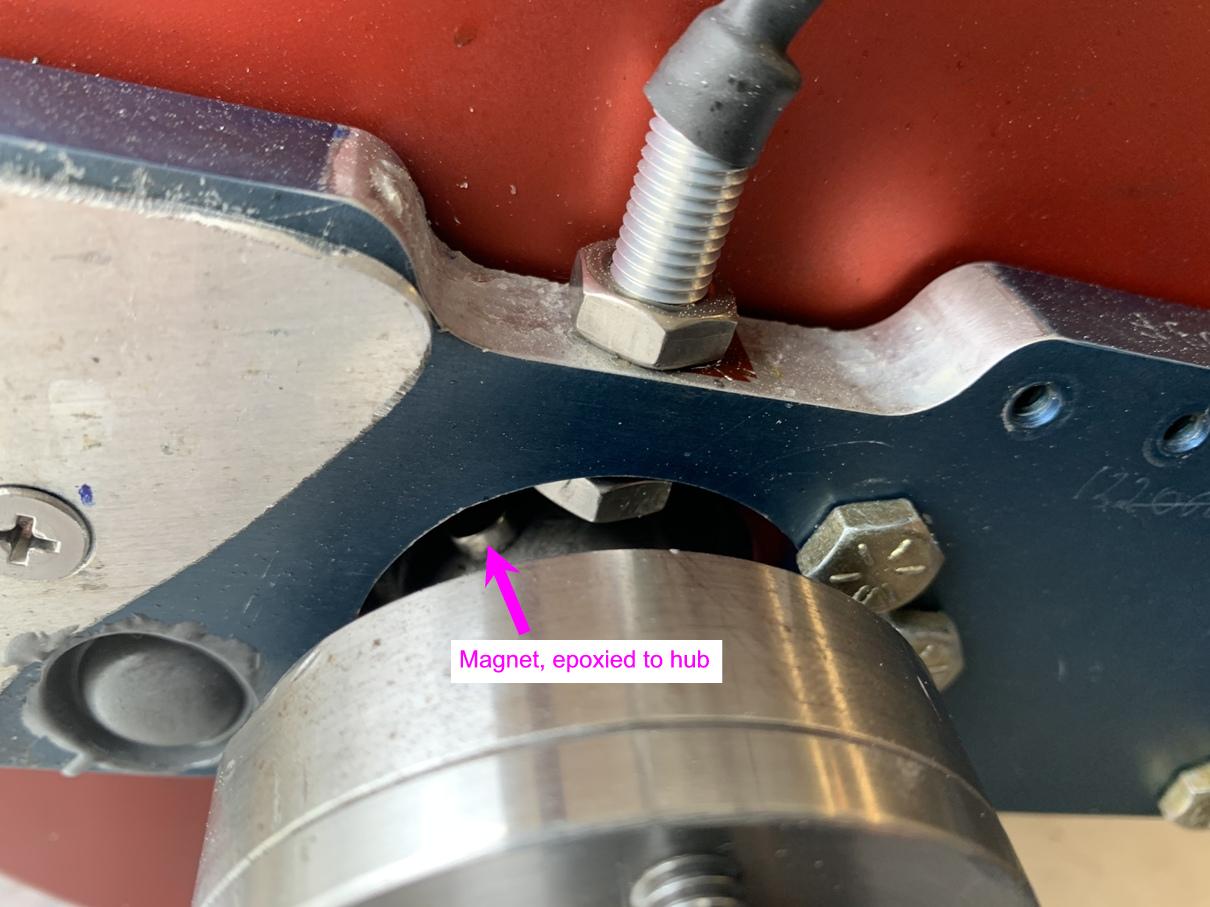
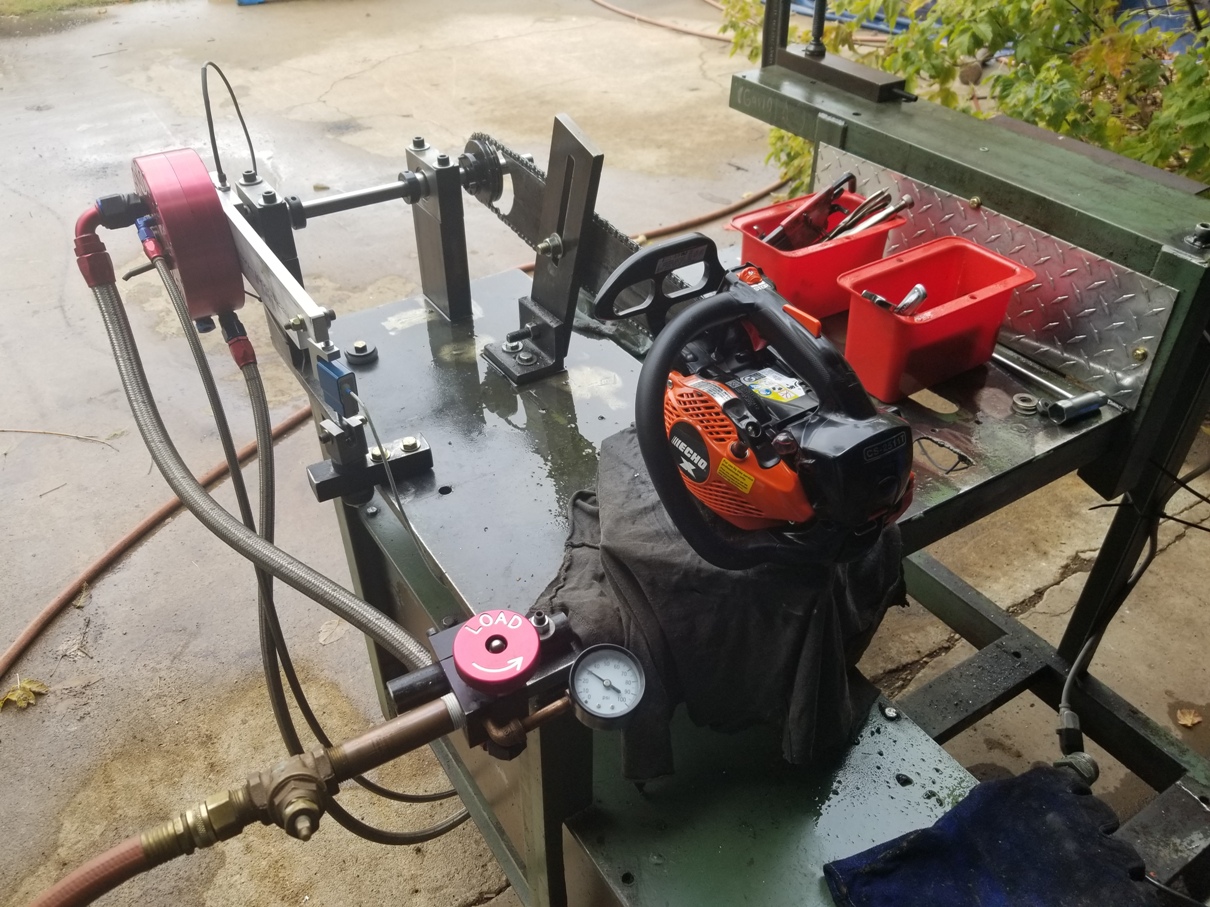


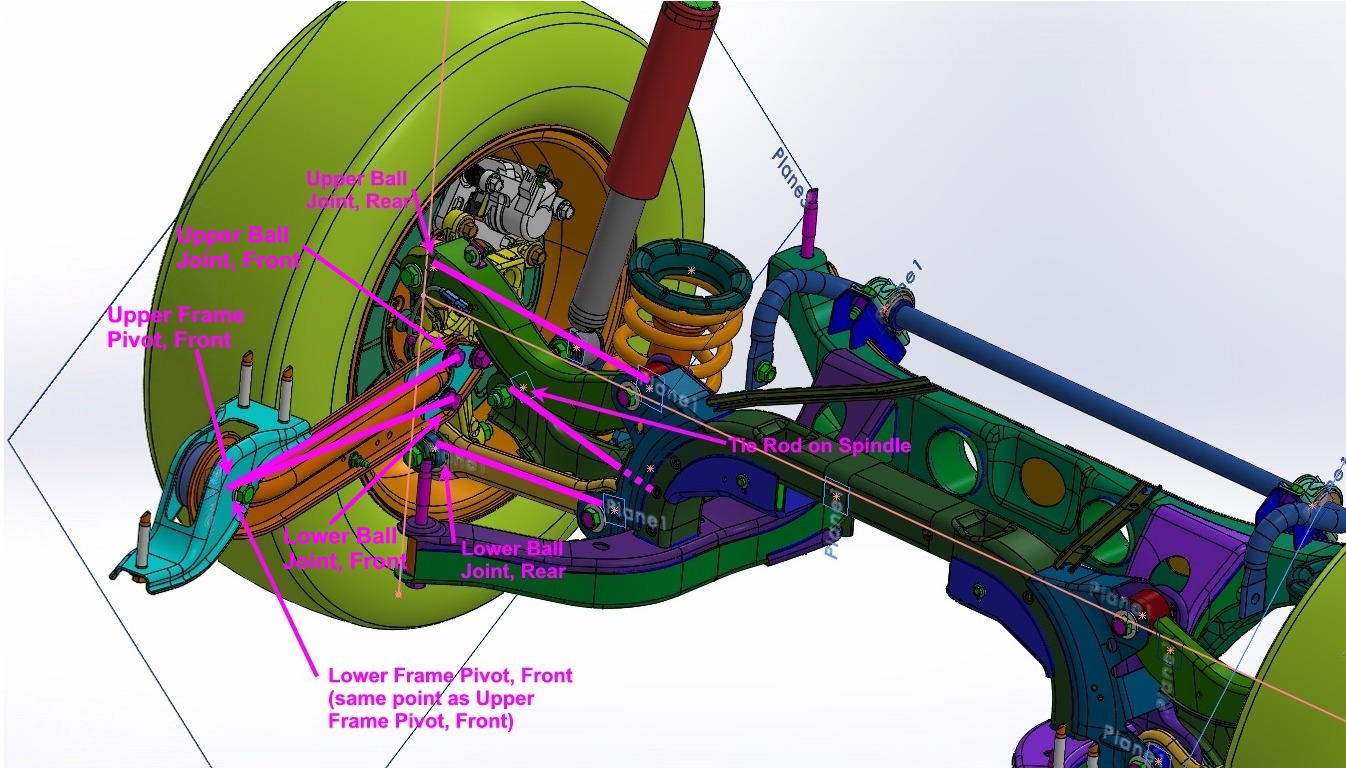

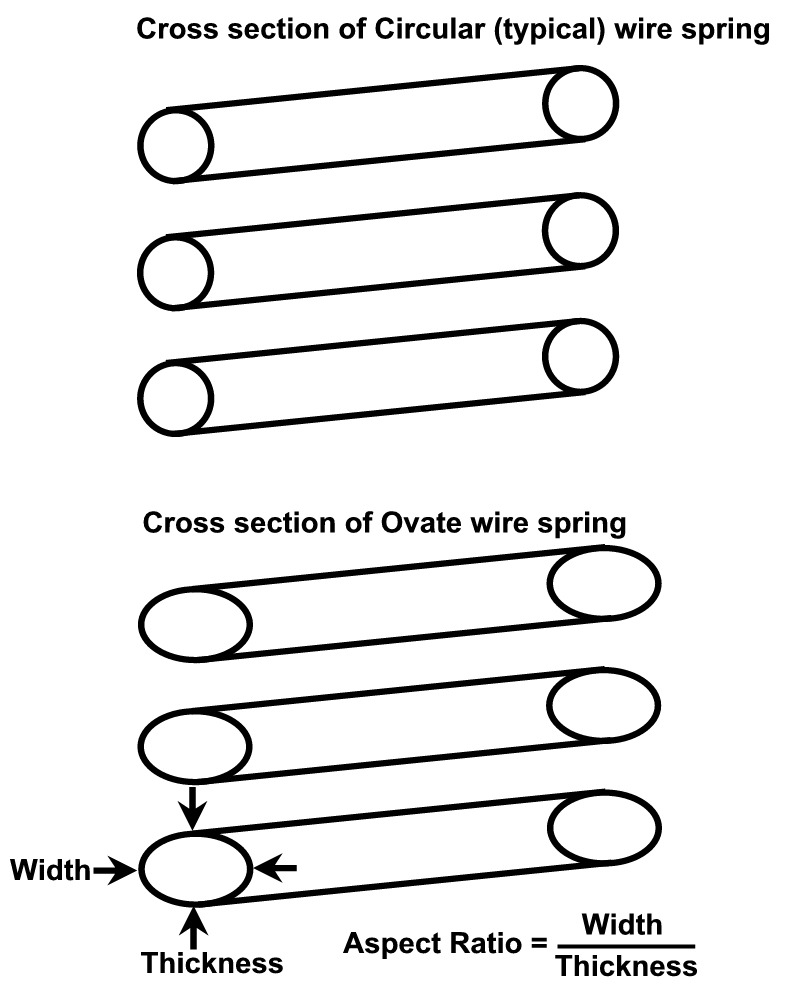