Performance Trends, Inc.
Producing Quality Computer Tools for Racers and Engine Builders since 1986
Dyno DataMite Enterprise Edition
The Enterprise Edition adds advanced features to the already powerful Professional version of the Dyno DataMite software.

There are 13 major enhancements beyond the Pro version, including:
- Reading OBD2 data
from the vehicle controller.

- Include a picture of the engine you are testing,
or the vehicle the engine's going in, or something else. This picture
can be printed with graphs and reports.
- Averaging Power Runs together.
- Allowing for doing an accelerating and then decelerating portion of a
power run, and using the decel portion to estimate losses in the system.
- Allow for manually editing out "noise spikes" in RPM data when
the program can not find the spikes by itself.
- Allow for recording Spark Advance with appropriate versions of DataMite
4. If you own a DataMite 4, it may need to be return so it can be
reflashed.
- Allow for combining 2 torque sensor readings (typically load cells)
together for a total torque reading.
- Six more bar gauges on the Current Readings "live" display. These are shown on the right side of the screen shown above.
- Live torque and HP curves drawn as you run your test on the Current Readings "live" display. This shown to the right of the round, dial gauges on the screen shown above.
- You can enter an Engine Inertia value directly if you select to have the program correct for engine inertia effects for the acceleration or deceleration rate during a test.
- There is a Preference setting where you can select to store your data files on a shared drive or hub. This lets data files be more easily stored between different computers.
- Enhanced Dyno Controller feature: You can construct a Controller Schedule to step through through various RPMs. This is ideal for doing break ins.
- You can specify a Min and Max RPM and the program will automatically start recording data at the Min RPM and stop recording at the Max RPM, and display the exact time between these 2 RPMs. This is ideal for inertia dynos.
These are described below.
Reading OBD2 Data: OBD2 was a requirement for all light duty vehicle manufacturers starting in 1996. Therefore, most modern vehicles have an OBD2 connector and can provide this data, as shown below:

The channels which can be chosen at this time include:
- Coolant Deg F
- Coolant Deg C
- Fuel Pres PSI
- Fuel Pres KPa
- MAP PSI
- MAP KPa
- Eng RPM
- Speed MPH
- Speed KPH
- Ign Timing
- Int Air Deg F
- Int Air Deg C
- Mass Air lb/hr
- Mass Air gm/sec
- Throttle %
- Throttle Deg
Note: This list is likely to grow. However, not all vehicle controllers support all channels listed here.
OBD2 data is very handy on chassis dynos, where you typically have a modern engine controller, and can not quickly install and remove additional sensors for quick vehicle testing. One important use is to record engine RPM for the dyno test via OBD2 instead of a tach signal, inductive pickup, optical sensor, etc. These other methods do work, but may require some tweeking to work in all situations.
OBD2 Link, Part #: DT4-OBD2
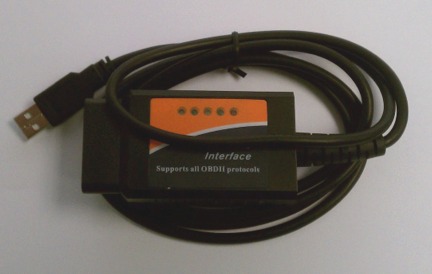
OBD2 data can NOT be recorded at a very fast rate, about 10 data reading every second. This is a limitation of the OBD2 function on the controller. Therefore, if you request 5 OBD2 channels to be read, you will only get 2 readings from each channel every second. If you require faster OBD2 data, you must reduce the number of channels requested.
Graph below shows 3 OBD2 channels of Engine RPM (blue), Ignition Timing in degrees (light blue), and Mass Air Flow in gm/sec (red). Included for comparison is Engine RPM recorded via an inductive pickup in green. You will see how the OBD2 channels are recorded only every 0.3 seconds, with straight lines connecting these data points. The green DataMite engine RPM reading is updated 50 times each second, and is a more fast responding, accurate reading. You will notice that it is ahead of the blue OBD2 Engine RPM reading.

NOTE: This data was recorded by just blipping the throttle, so the engine conditions were changing very quickly. This was done to point out some limitations of the OBD2 data. When recorded during a more slowly accelerating dyno test, these limitations are not as pronounced.
Test Piece Picture File: On the main screen, there is a "File" button in the Test Piece picture frame. Click on it and you are presented with options to Print the picture, add a new picture file, or remove the picture file. The pictures below show how the picture file is presented with results.
Including an Engine, Vehicle, or "Test Piece" picture with a test

 (click images to enlarge)
Averaging Power Runs: Many users like to record several runs and then average them together to obtain a single torque and/or HP curve. This provides for easier and better comparisons between engine modifications, especially if the effect of a modification is small. Shown below is a graph of 3 individual runs. Each run was done with a different length header pipe and should be different. However, because they are different you can easily see how averaging works. You can see that the torque and HP at each RPM is the average of the torque and HP of each individual run at that particular RPM.
You can pick which tests you want averaged together by clicking on the "Graph?" column while holding down the Ctrl key. You can then choose to use the run in an average by assigning a "Group Number", from 1 to 100. The program will then average the runs with the same group number together if you have selected to do averaging (see screen below).
Averaging 3 Different Tests Together
Graphing Averages from 2 Different Groups, (2) and (1)
Telling Program to Include Averages in the Graph
Accel/Decel Runs to Correct for Losses: Many users have requested that after doing an accelerating power run, the vehicle (or sometimes engine) is allowed to coast down. Data is recorded during the coastdown and this data is used to estimate the driveline and dyno frictional losses.
![]() for
an FAQ describing how this feature works
for
an FAQ describing how this feature works
Advanced Edit of RPM Noise Spikes: Occasionally the program can not "see" noise spikes if several occur very close together. The program my think it is real data. However, if they occur in the critical RPM data, a test may be completely ruined by these spikes even if 97% of the other data is perfect. Under the Edit command the Enterprise version has an "Advanced Edit of RPM Noise Spikes" option. It lets you manually "cut out" the bad section of noise spikes and replace it with a straight line of RPM data to replace it.
![]() for
an FAQ describing how this feature works
for
an FAQ describing how this feature works
Measuring Spark Advance in Degrees: Using a special firmware version of the DataMite 4 allows for Spark Advance to be recorded as the 4th RPM channel. This is done by measuring spark timing pulses on RPM channel 1 (typically using an inductive pickup, but possibly a tach signal), and a crank position signal on RPM channel 2. The crank position signal does not have to be at any specific location, but it is best if it is approximately 10 to 30 degrees After TDC firing. If setup properly, you can then calibrate the spark advance channel using a timing light with the engine running. Once calibrated, spark advance in degrees is displayed on the Current Readings screen, or recorded with your dyno data.
![]() for
PDF describing how this feature works
for
PDF describing how this feature works
![]() for
PDF showing repeatability of Spark Advance measurement for 3 V8 dyno runs
for
PDF showing repeatability of Spark Advance measurement for 3 V8 dyno runs
The graphs below show Engine RPM, OBD2 Spark Advance and Measured Spark Advance recorded on a 2008 Ford Ranger with standard DataMite magnetic pickup (BB2-RPML) with 1 magnet on the crank pulley, and inductive pickup with simple clamp (DTM-IPU) on #1 spark plug. The magnet was epoxied at approximately 12 deg ATDC. You will notice that spark advance changes very quickly as the throttle is blipped and RPM jumps up. You will also notice that the Measured Spark Advance matches the OBD2 spark advance very closely, but when spark advance changes, the Measured Spark Advance changes much more quickly. This makes sense as the OBD2 readings are only captured every 0.1 second, but the Measured Spark Advance is recorded every 0.02 seconds (50 times a second).
This needs to be emphasized: Spark Timing is one of the most critical settings to obtain maximum engine performance; too little and you loose power, too much and you loose power and risk detonation, pre-ignition, and engine damage. You may think you can check the timing at, say, 3000 RPM before your dyno test with a timing light and then assume it is staying constant, or advancing like it should. But when you can actually measure it, now you can be sure. Perhaps it looks good at 3000 RPM with your timing light, but you get to 5000 RPM and it is jumping (called spark scatter) +/- 4 degrees (an 8 degree spread). That is certainly useful information, especially if you are running into detonation and/or pre-ignition problems.
Measured Spark vs OBD2 Spark with Engine RPM

Measured Spark vs OBD2 Spark

Two (2) Torque Readings: Some dyno systems have 2 load cells, sometimes on 2 different brakes or absorbers. In Enterprise you can specify 2 torque channels and their torques are added together for a total torque channel, as displayed below. The 2 separate torques are displayed on the 2 horizontal bar gauges, and Total Torque is displayed on the round gauge on the right.
